Make New Entry, Make Followup Entry
User name Yi Qiang
Log entry time 13:59:10 on February 22, 2009
Entry number 262677
Followups:
keyword=Gas Cherenkov study from ep elastics data run 1258-1262I used the root files replayed by Yi Zhang in which no event bit
information included so I didn't cut on event type at all.
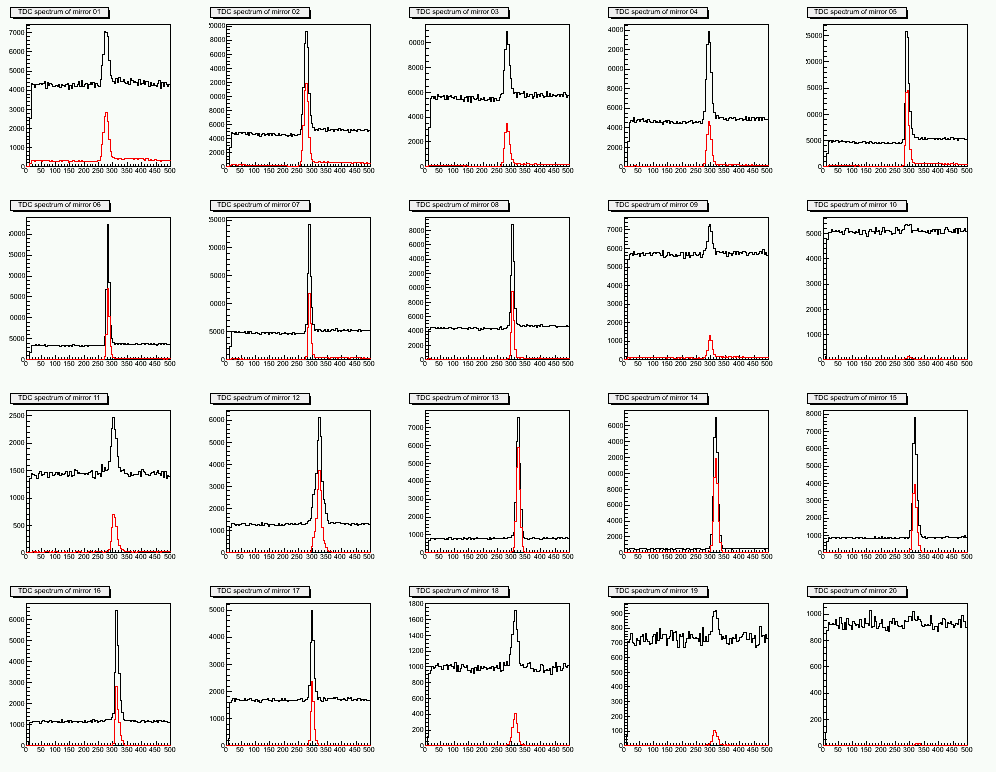
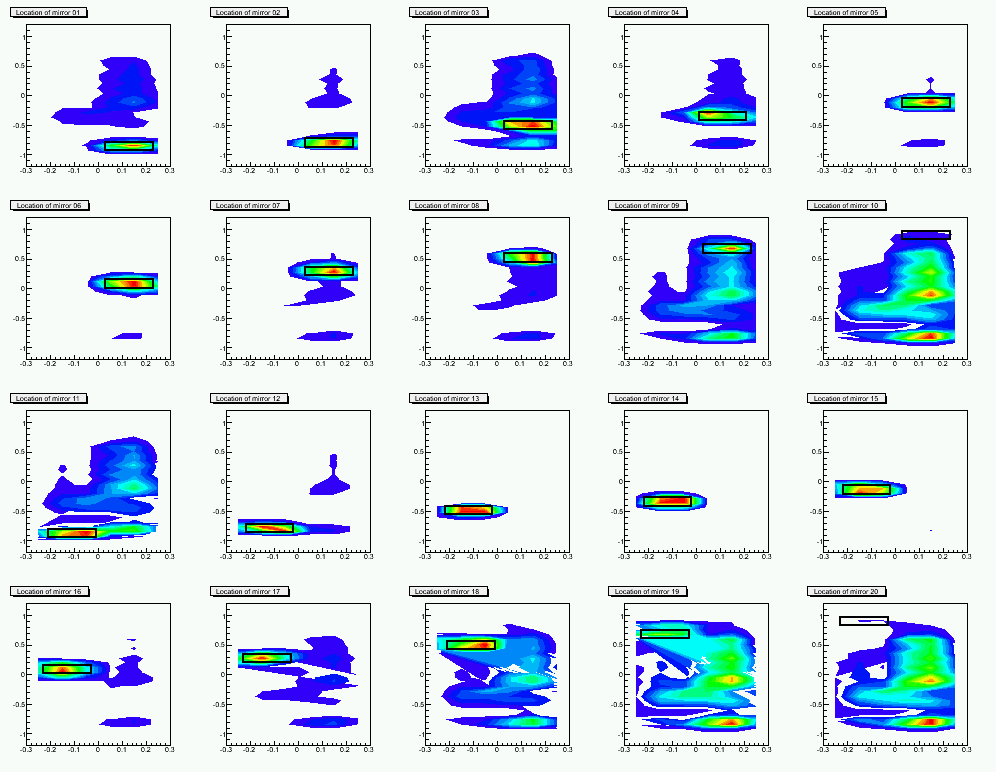
I first checked the TDC and Mirror positions of these runs, see figure 1
and 2 and slightly changed my cut definition according to them.
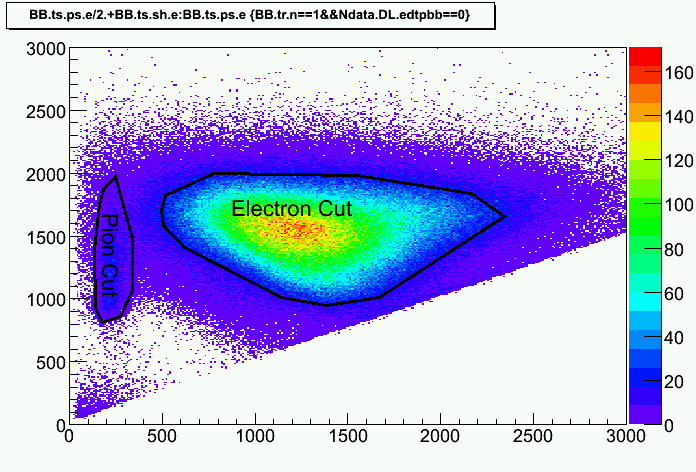
Then I defined two graphic cuts for electrons and pions on the E/Delta E
plot, see figure 3. The coincident electrons are also well within the
cut, see figure 4.
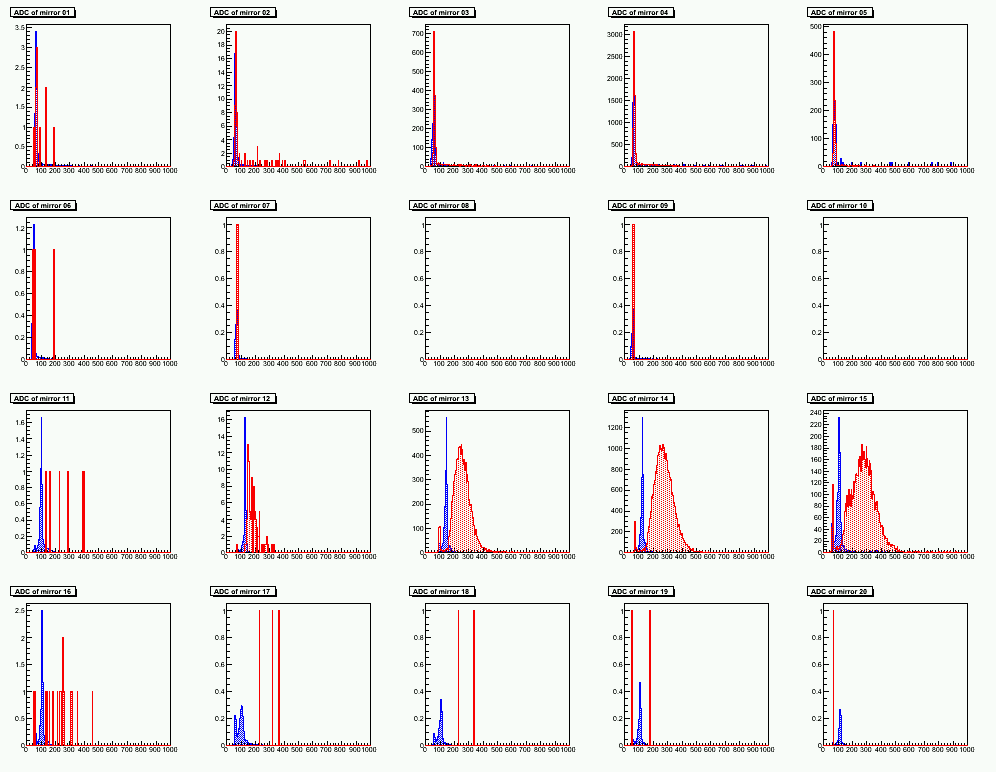
Now it's time for ADC spectra! Figure 5 shows ADC spectra from all
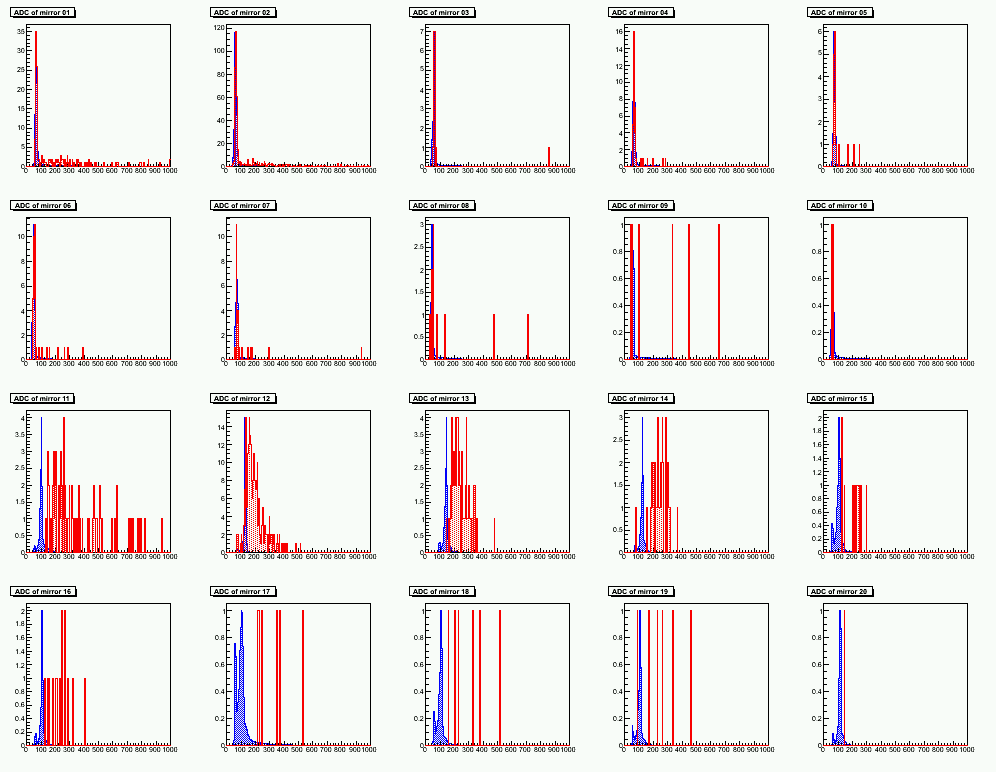
electrons, while figure 6 shows only ADC from coincident electrons.
Surprisingly, the ADC signals from the first 10 mirrors (beam line side)
is pretty much only the pedestals and this does not make sense at all
unless there were some hardware issues. I will cover this later.
From the PMTs which still have signals with coincident electrons, mirror
13,14 and 15, the ADC amplitudes seem consistent with accidental
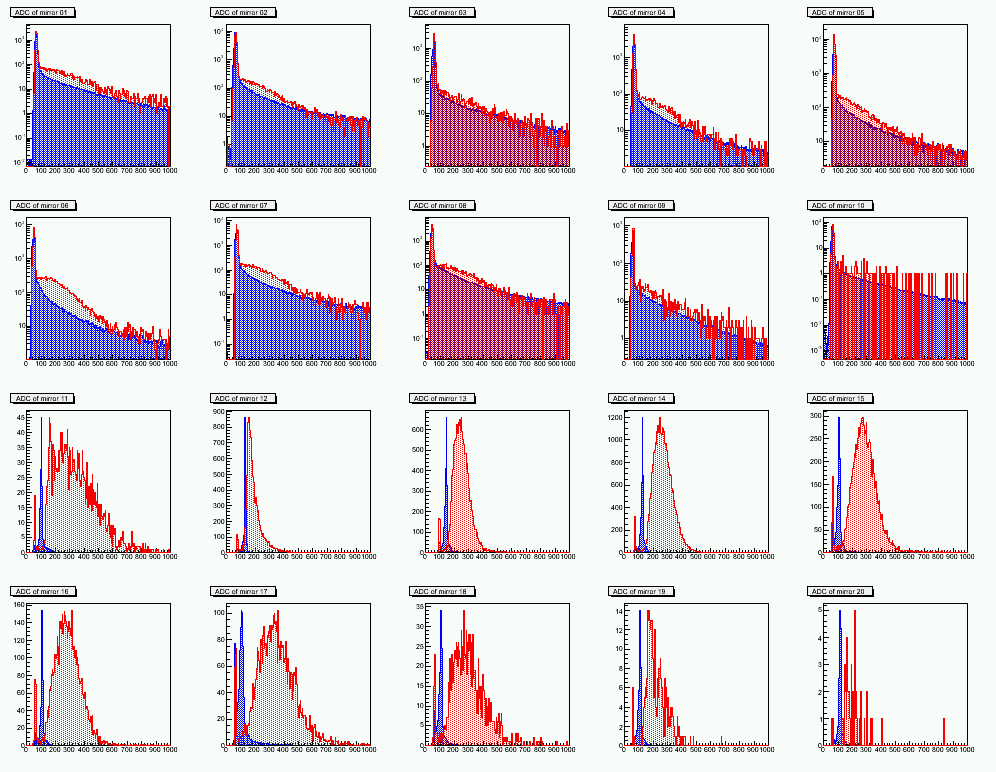
electrons. Figure 7 is ADC spectra from pions and clearly the ADC
amplitudes are less than those from electrons.
Now let's take a closer look of the beam line side PMTs, see figure 8.
The ADC spectra are different from the pure background in large
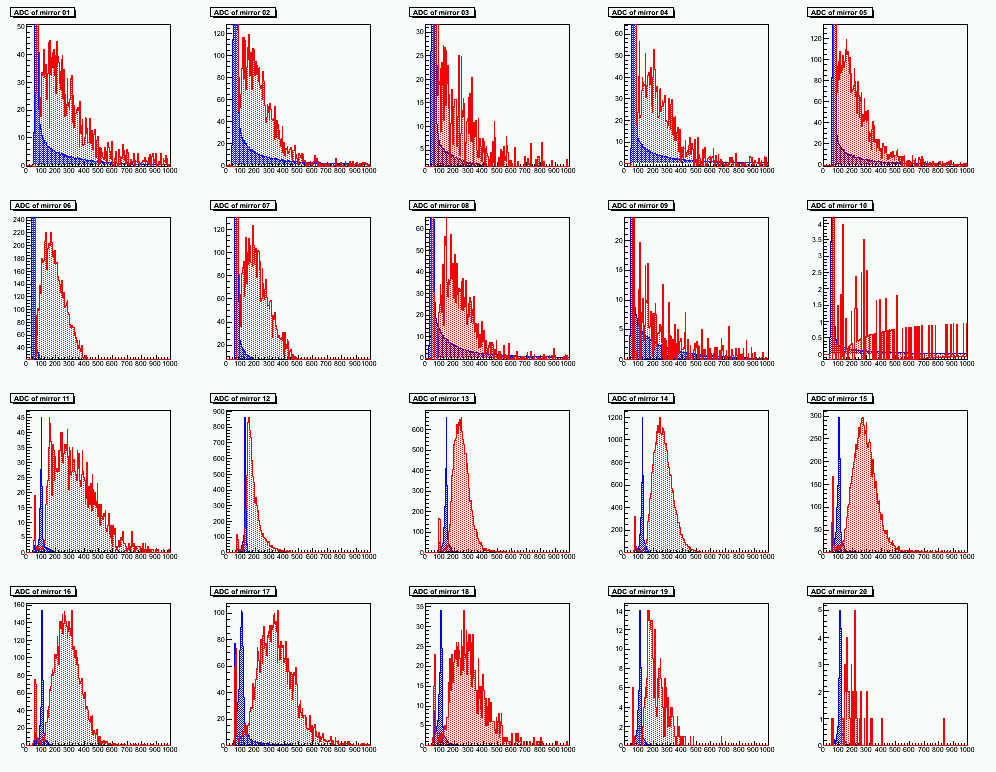
amplitude. So I did a background subtraction in these 10 channels to get
figure 9 and these amplitudes are about half of the normal amplitudes
from right HRS side. The thing confusing me is here. First of all, all
these signals have passed the discriminators as those from the PMTs in
the other sides, so if the ADC gate is set correctly, we will definitely
see a cut off as we saw in the other 10 channels. If the ADC gate is
completely off, we should see no difference between the signal and
background. However we saw some large signal events, so maybe the signal
coming around the edge of the ADC gate?
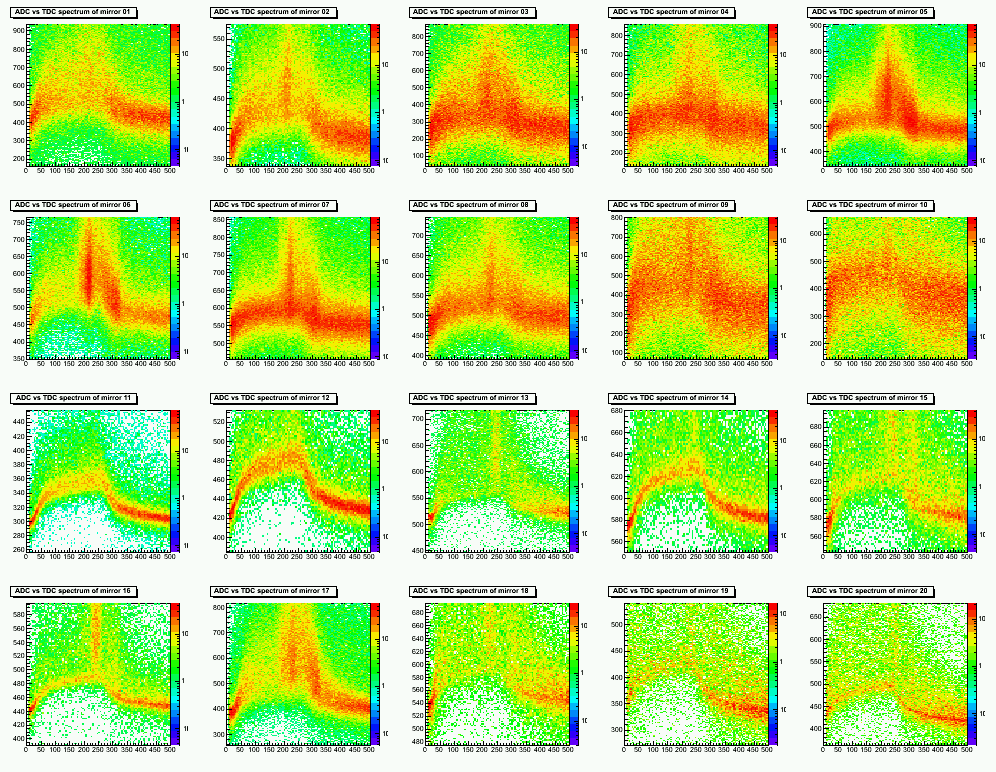
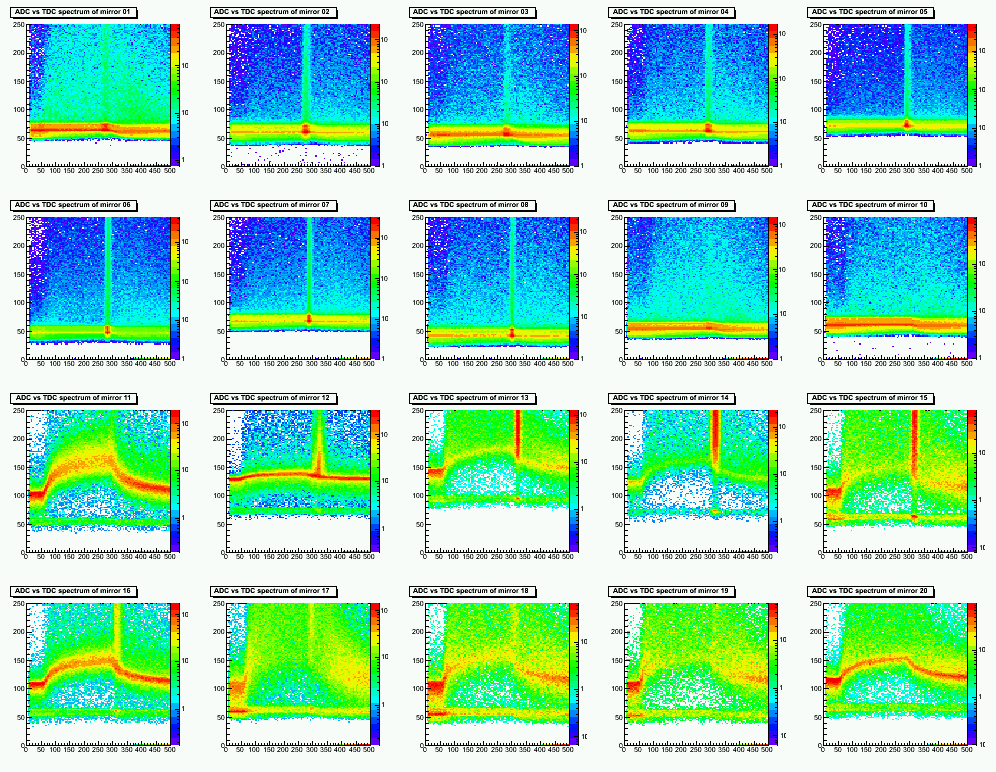
With this question, I made the ADC vs TDC plots, see figure 10 and figure
11. The threshold cut off is very clear in the Right-HRS PMTs: the range
of the hat shape along TDC axis tells us the duration of the ADC gates
and the maximum shift in ADC axis tells us the effective threshold. From
those normal channels, we can read that the ADC gate is from 70 to 320
TDC channels which is about 130ns and the threshold of the discriminator
is about 50 channels in ADC. However the plots from PMT 1-10 do not show
such large threshold effect, and instead of 50 they give less than 10
channels' shift. PMT 12 also suffers from this problem though less
severely. If we say that the constants of channel/charge are different
from channel to channel, this only make sense with PMT 12 since we saw
both drop in the ADC amplitude and the threshold. But for PMT 1 to 10,
the problem is not so simple, and we will need inputs from experts.
Now let's go back to the ADC gate timing, though the range of ADC gate in
TDC channels is from 70-320, due to the width of the signal pules, the
ideal position to put the signals is within channel 200 - 300.
Unfortunately, all our signals from Right-HRS PMTs were not well in this
range, and the further the PMT is from this range, the less amplitude
will be recorded in ADC. Therefore, I think the amplitude "walking
effect" is mainly due to this reason.
To make you comfortable, I plotted the ADC vs TDC from a recent run,
1580, see figure 12. All channel look fine now!
A copy of this log entry has been emailed to: meziani,brads,xqian,zhangyi,flay,posik
TDC check (red: w/ mirror cut)
Mirror geometry cuts (w/ TDC cut)
Graphics cuts for electrons and pions
Coincident electrons

ADC spectra for all electrons (w/ TDC, Mirror cuts)

ADC spectra for coincident electrons (w/ TDC, Mirror cuts
ADC spectra for all pions (w/ TDC, Mirror cuts)
Log scale electron ADC spectra
Electron ADC spectra with background subtraction
ADC vs TDC
Zoom in of ADC vs TDC

Current ADC vs TDC (from run 1580)