Make New Entry, Make Followup Entry
User name D. Parno
Log entry time 14:19:19 on February 23, 2009
Entry number 262900
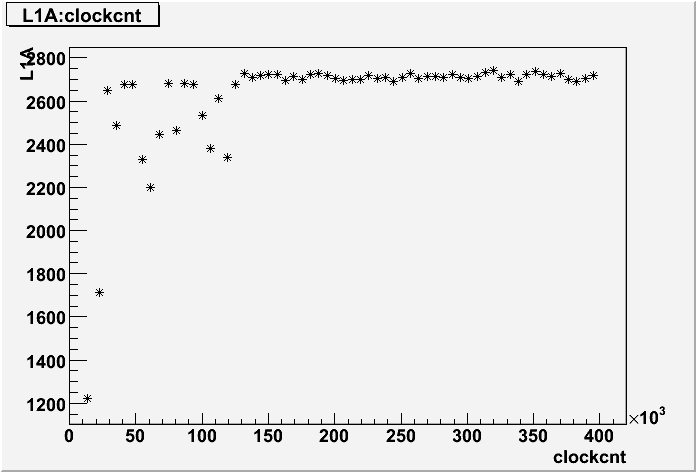
keyword=Syncroc studies: L1A vs Clock for Run 1597To help pin down the glitches in the syncroc studies, we're plotting BigBite's L1A signal as a function of the clock (clockcnt) for selected runs where glitches were observed.
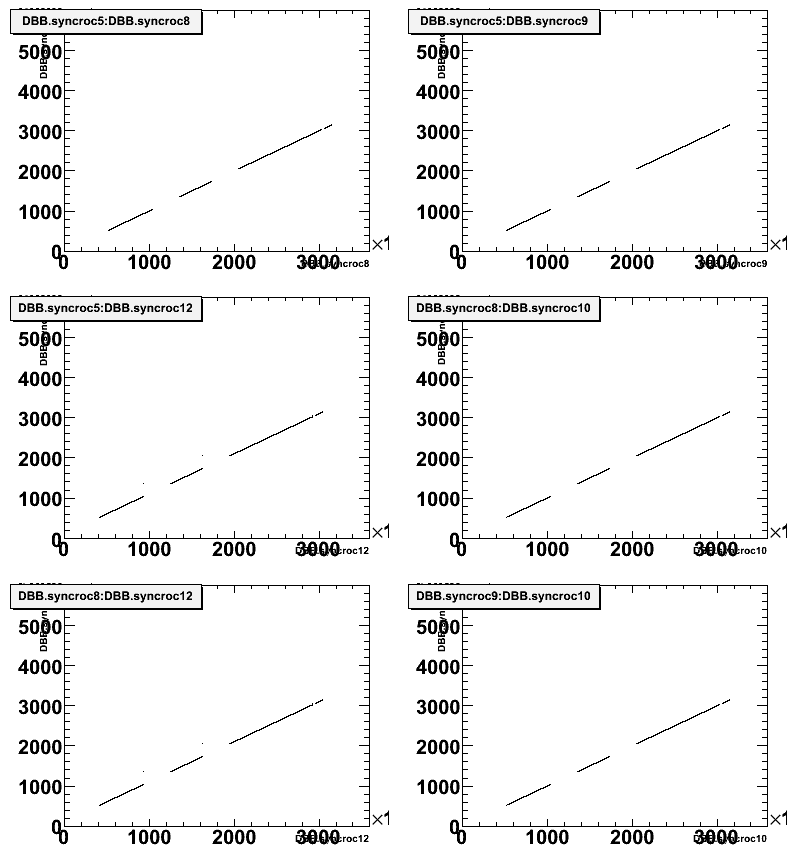
Run 1597 was taken during the day shift on 19 Feb. Fig. 1 shows the ROC synchronizations for the first 50,000 events. Fig. 2 shows L1A:clockcnt for the first 1,000,000 events.
We expect L1A:clockcnt to be a relatively flat line. The deviation near clockcount = 0 is not necessarily alarming; it could represent the beam ramping up after a trip. However, there is some ugly noise that we do not understand near the beginning of the run. The line flattens out later on, which may mean better quality data.
At a rough estimate, the 50,000 events used for Fig. 1 are at about x <
25,000 on Fig. 2.
A copy of this log entry has been emailed to: brads, kalyan, flay, posik, moffit
Figure 1

Figure 2
