Make New Entry, Make Followup Entry
User name D. Parno
Log entry time 13:32:49 on March 03, 2009
Entry number 264317
This entry is a followup to: 264311
Followups:
keyword=New structure in LHRS S2 ADCsWe're trying to get to the bottom of higher T3 rates (~600 Hz) in the LHRS after the polarity change and return of beam today.
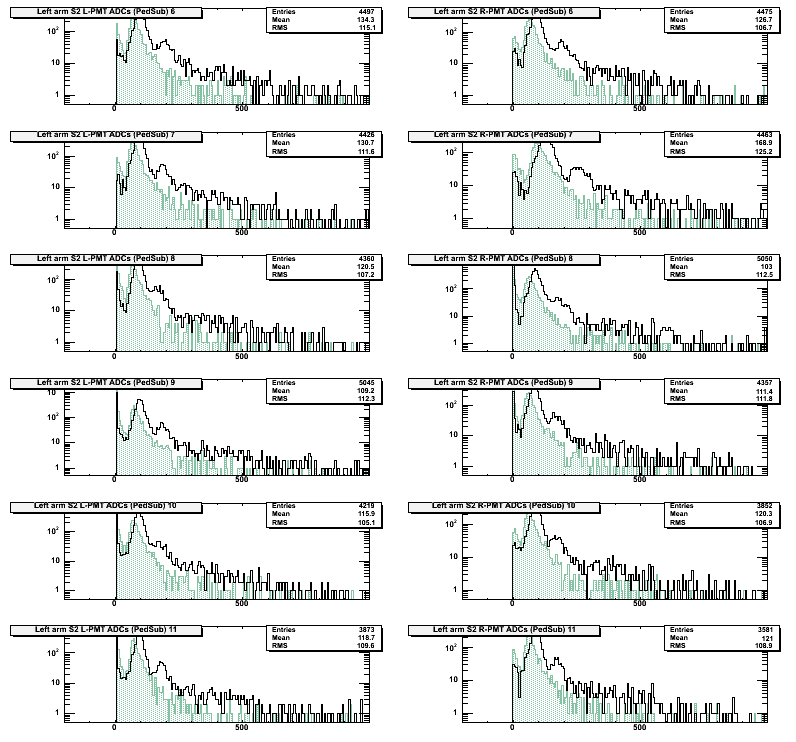
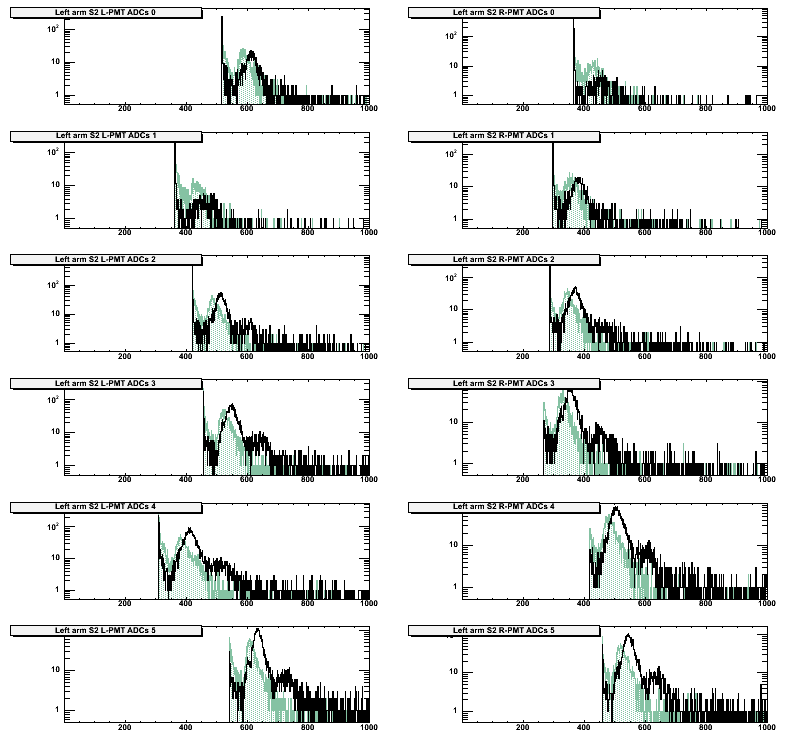
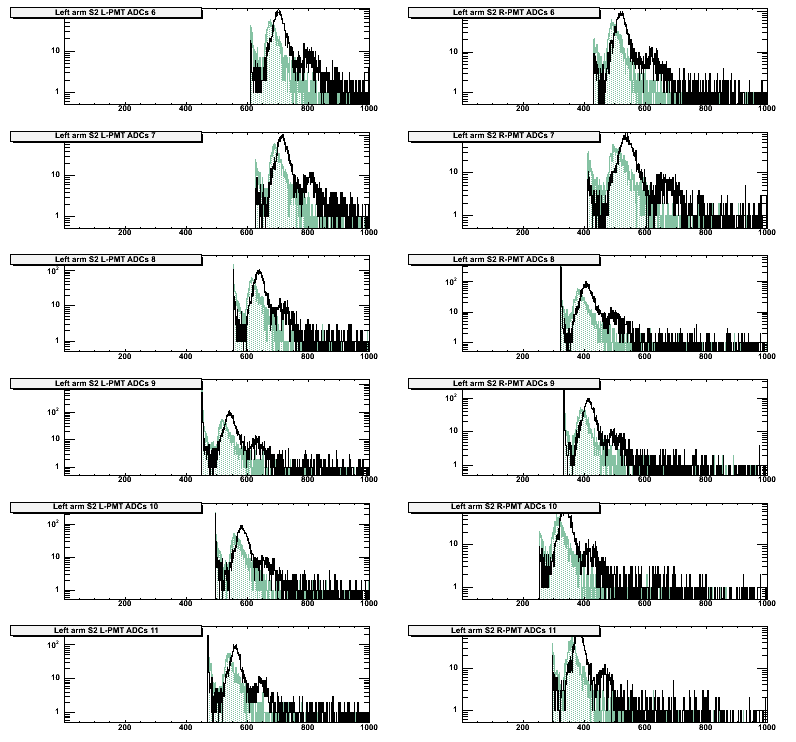
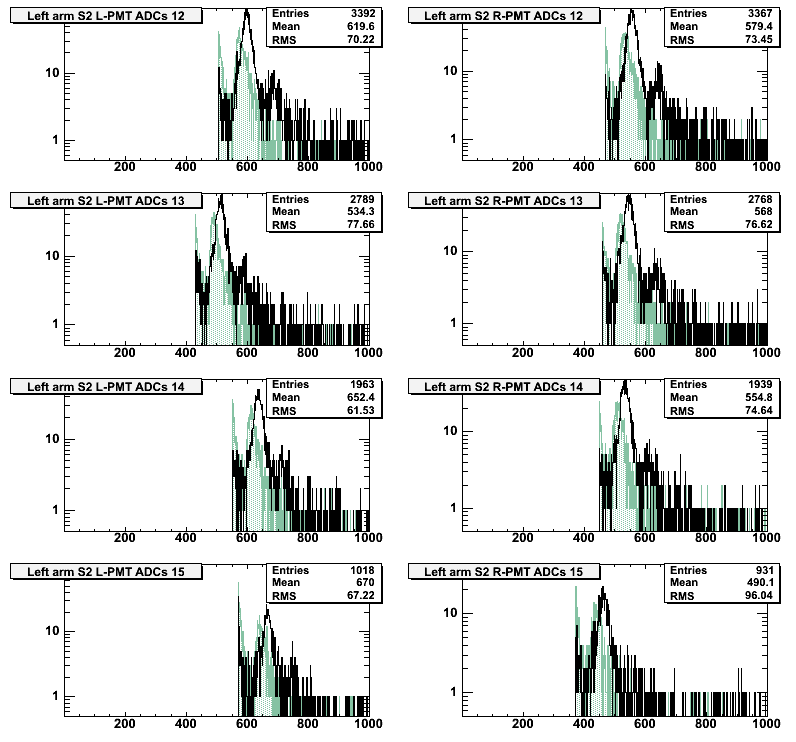
The figures below (for an N2 reference cell run) show a change in the structure of the S2 ADC signals since weekend running. There is a second peak at higher bin than the first, with a clear separation between the two (Fig. 1-3). This also shows up in the plots of the same signal without pedestal subtraction (Fig. 4-6).
I don't see structural differences in the other online plots.
A copy of this log entry has been emailed to: brads, vasulk, riordan
Figure 1

Figure 2

Figure 3

Figure 4

Figure 5

Figure 6
