Make New Entry, Make Followup Entry
User name Kalyan
Log entry time 13:08:58 on April24,2009
Entry number 267887
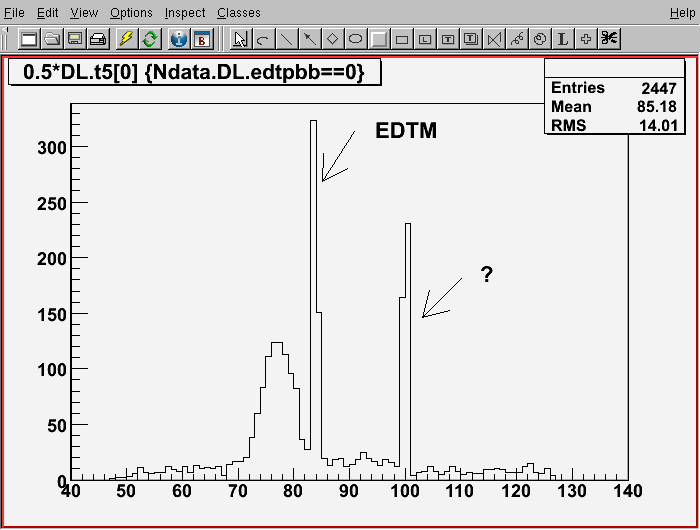
keyword=coincidence time spectrum for H2 elasticPlot shows coincidence time spectrum for the H2 elastic run. There few issues here.
1. If the re-timing is done at the bigbite then this spectrum should show-up in DL.t3 variable, instead it is in DL.t5.
2. If there is no re-timing then this is what we expect.
3. It seems like the EDTM signal is not plugged into the TDC, so EDTM peak still there even if I cut it out.
FIGURE 1