Make New Entry, Make Followup Entry
User name miham
Log entry time 03:36:13 on June 08, 2009
Entry number 279790
Followups:
keyword=Hydrogen elastic run #3265 analysis
Today I analyzed hydrogen elastic run #3265 (taken on Saturday)
in order to check if we see any elastic protons in BB and
HRS-L. I analyzed only coincidence events (T5s). According to my
analysis there is approximately 0.5M good coincidence events in
this run (4M). I plotted various graphs for this run - Please see
attached figures below:
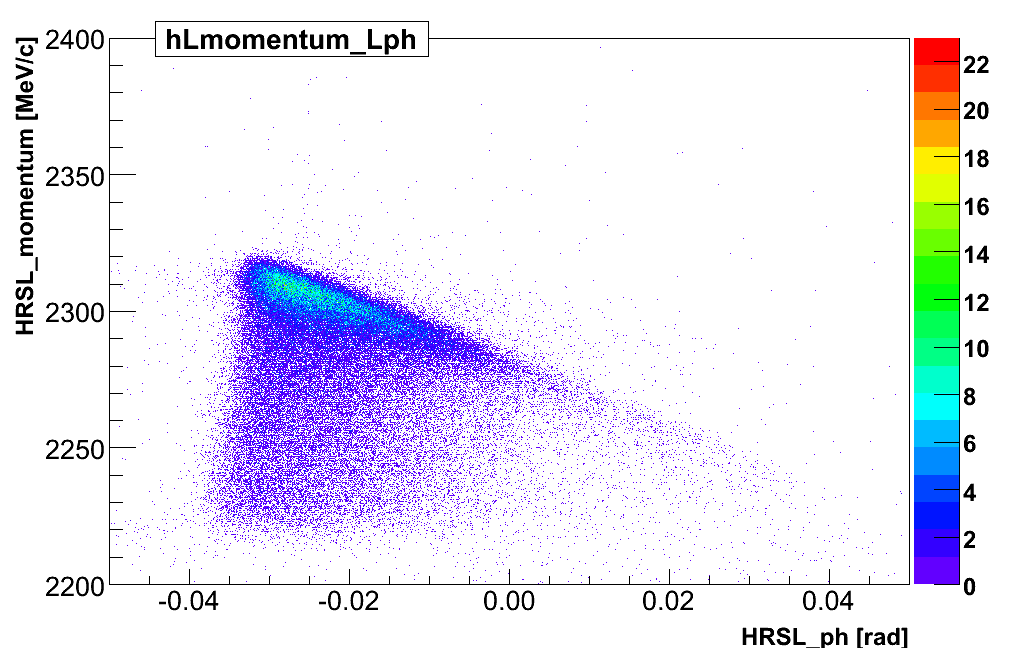
1.) In first figure, that shows L.gold.p vs. L.gold.ph, we can
see nice elastic stripe.
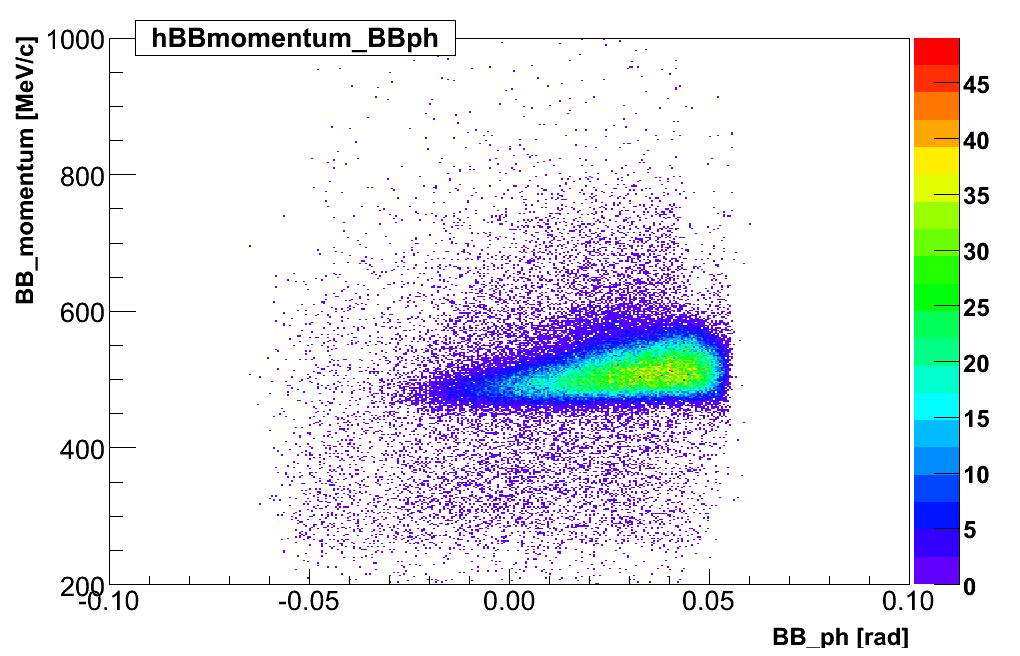
2.) Than I made the same plot for protons in the BB. We can see that
majority of elastic protons is pushed to the right side.
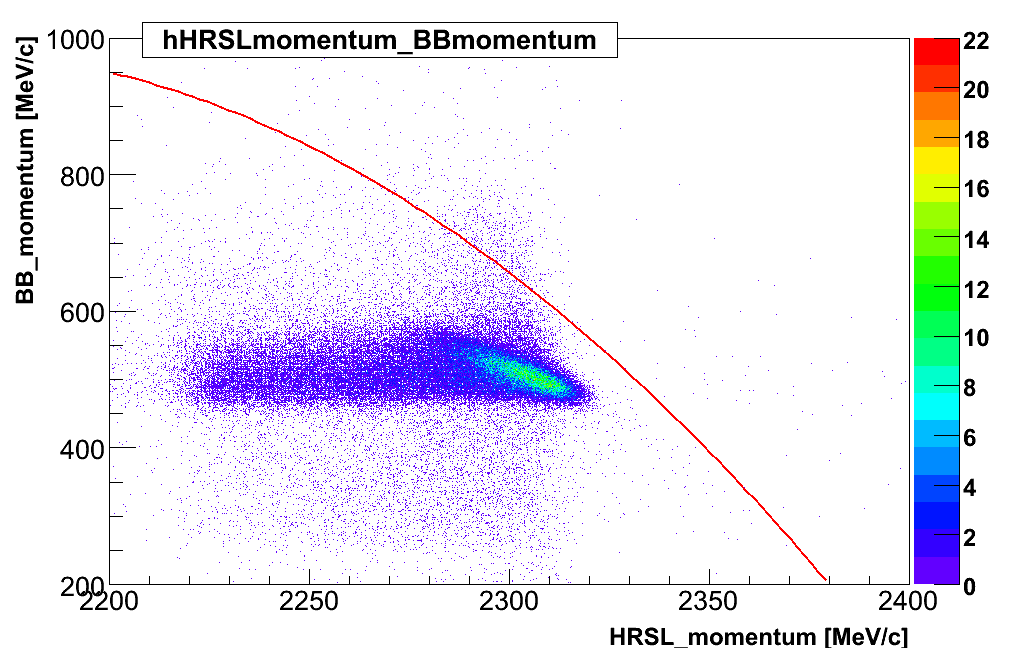
3.) Third plot shows Proton momentum in BB vs. electron momentum in
HRS-L.
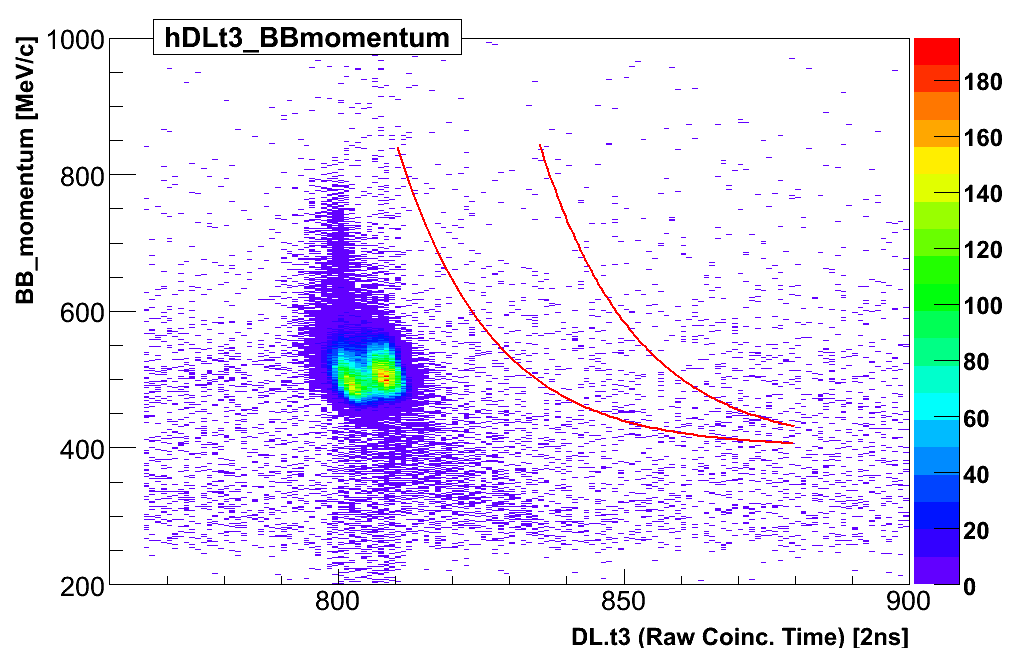
All these plots look reasonably nice. However, when I plotted proton
momentum vs. DL.t3 (raw coincidence time) I saw two peaks - Please
see plot No4. This was obviously an artifact of something. I was having
many problems finding the reason for that. First I suspected (and
was seriously afraid) that something is wrong with the trigger or
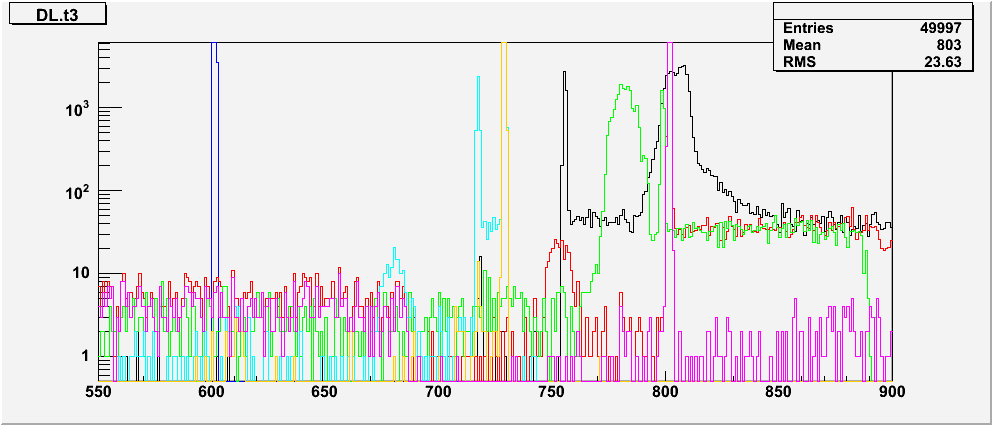
BB re-timing. Therefore I checked trigger TDCs, and the plots seemed
to be OK:
----------------------------------------------------------------
Black Line - T3
Red Line - T1
Green Line - T2
Blue Line - BB re-timing
Cyan Line - T5
Yellow Line - T5 with cut: abs(DL.T3-805)<50 - Physical events
Magenta Line - T1 with cut: abs(DL.T3-805)<50 - Physical events
-----------------------------------------------------------------
BBretime should always be a sharp peak, because this signals stops
TDCs. T1 should also be sharp if our retiming works. Since Coincidences
are timed of T1 (we form coincidence window out of T3), trigger T5 should
also be a sharp peak because it is always at the same position,
relative to T1. T3 on the other hand is smeared around and represents
a raw coincidence time.
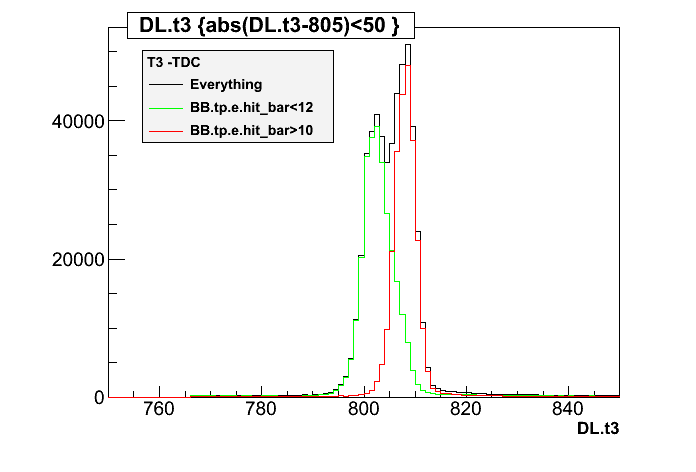
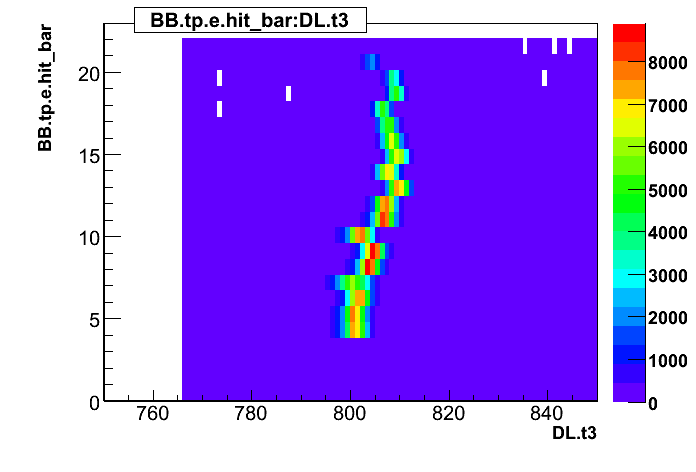
After few hours Simona and I finally found what causes double peaks
in DL.T3. Because of the re-timing that we are using, DL.T3 depends
on what happens in BB - in particular which paddle proton hit. Plots
6 and 7 show how DL.T3 changes with the hit BB scint. paddle. Time
differences, that we can observe between different paddles cause two
peaks in DL.t3. We believe that these time differences (few ns) could
be caused by different lengths of cables that we are using.
A copy of this log entry has been emailed to: doug, sirca, moffit
Electron momentum vs. scattering angle
Proton momentum vs. scattering angle
BB_p vs. HRSL_k
BB momentum vs. DL.t3
Trigger TDCs
BB hit bar vs. DL.t3
DL.t3 with various cuts.