Make New Entry, Make Followup Entry
User name miham
Log entry time 15:49:44 on June 12, 2009
Entry number 280806
Followups:
keyword=Quick Carbon Optics run AnalysisI have looked at two runs that were made yesterday : #3483(Sieve in)
and #3490 (Sieve out). I have plotted the Tg.y variable. For run without
sieve slit I see seven peaks that correspond to 7 Carbon foils
and one peak, that could correspond to Be0 window (Blue line on
the first plot). However, when I plot the same thing for the run with
sieve slit IN I see two additional peaks on the edges (Black line). What
causes these artifact peaks? Could we have a problem with the optics
matrix?
Afterwords I made a cut on the peak in the center (red line) and plotted
the Tg.Ph vs Tg.Th plot. We can clearly see holes in the sieve.
A copy of this log entry has been emailed to: doug, sirca
Tg.y

Tg.ph vs. Tg.th

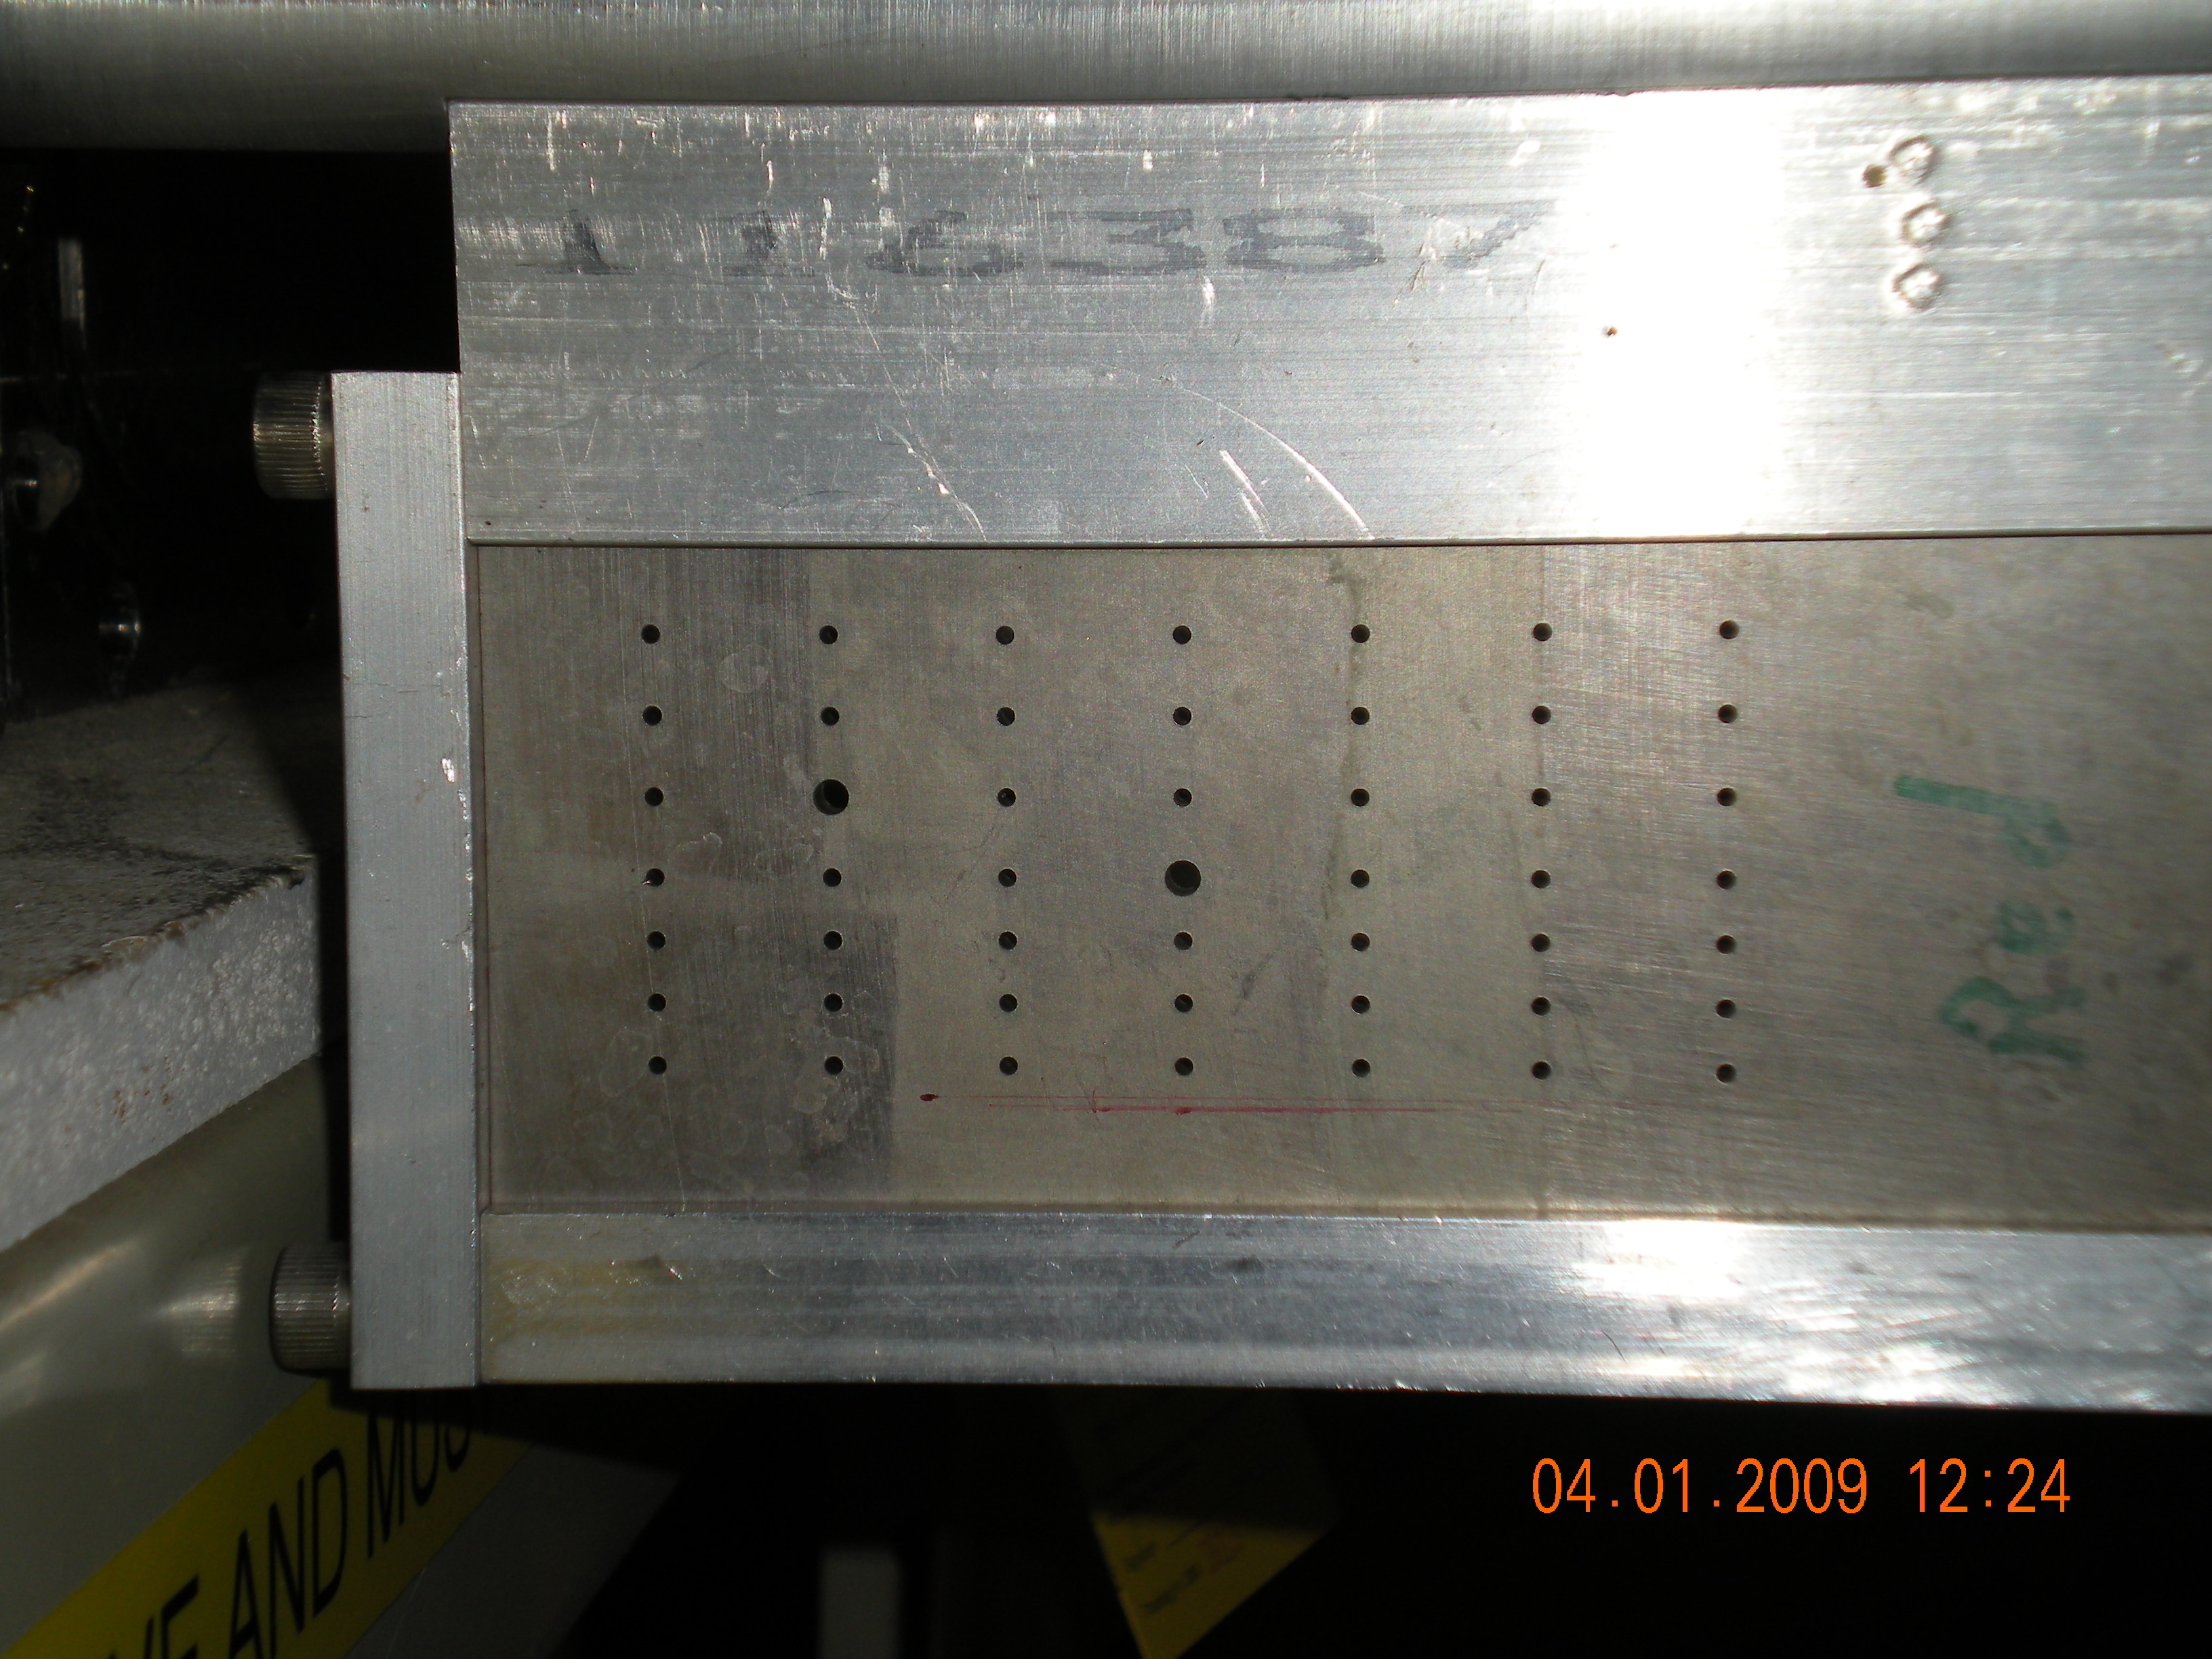
HRS sieve