Make New Entry, Make Followup Entry
User name yez
Log entry time 02:48:39 on October 15, 2010
Entry number 334952
keyword=Sieve Partten Analysis -- See holes for LH2 but not for Carbon foilsI quickly look at the sieve slit data we took:
7092,7093 for LH2, Sieve in, Raster on, totoaly 167 minutes data taking 7229,7230 for Carbon multi-foils,Sieve in, Raster on, 117minutes data taking
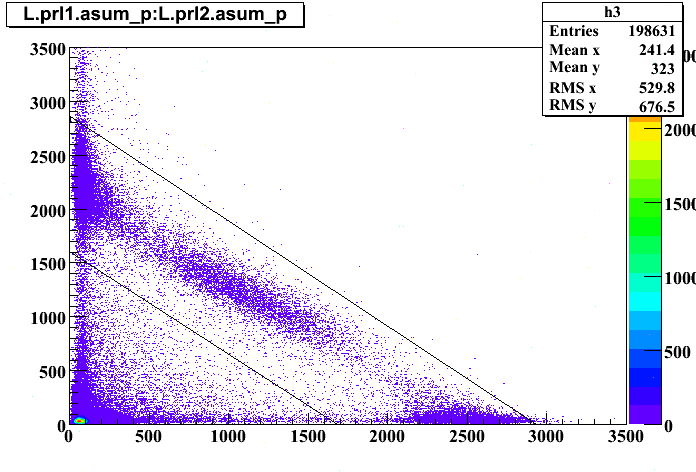
I applyed pion rejectors cut,which you can see from the graph Fg.1, has a strange distribution when I plot pr2_sum .vs. pr1_sum. I don't know how to expain this exactly (bad timing?)
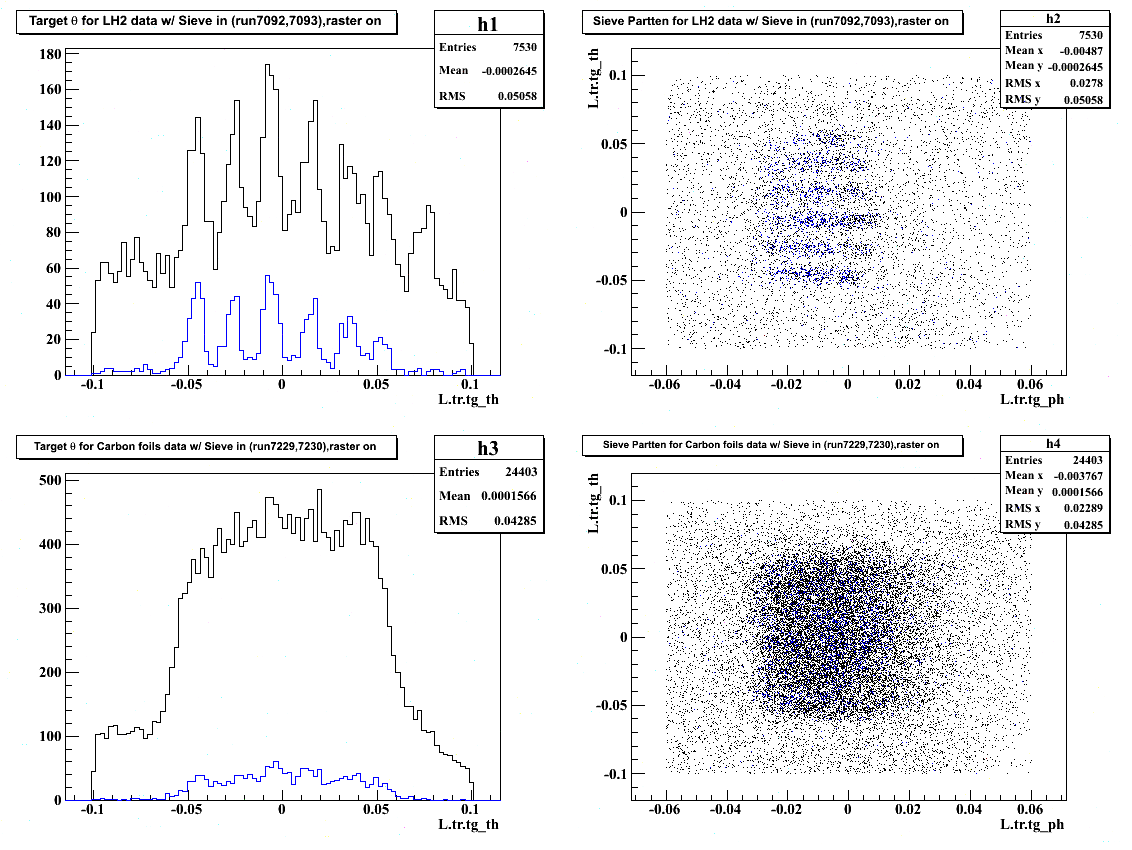
From Fg.2, you can see that without a vertex cut, LH2 data already show the sieve pattern, but for carbon, it does show something by looking at Theta angle distribution, and no sieve pattern is showed. I can not apply veterx cut on multi-foils because the replayed data does not show the multi-foils pattern. Probabily a lot of electrons punches through the sieve plate.
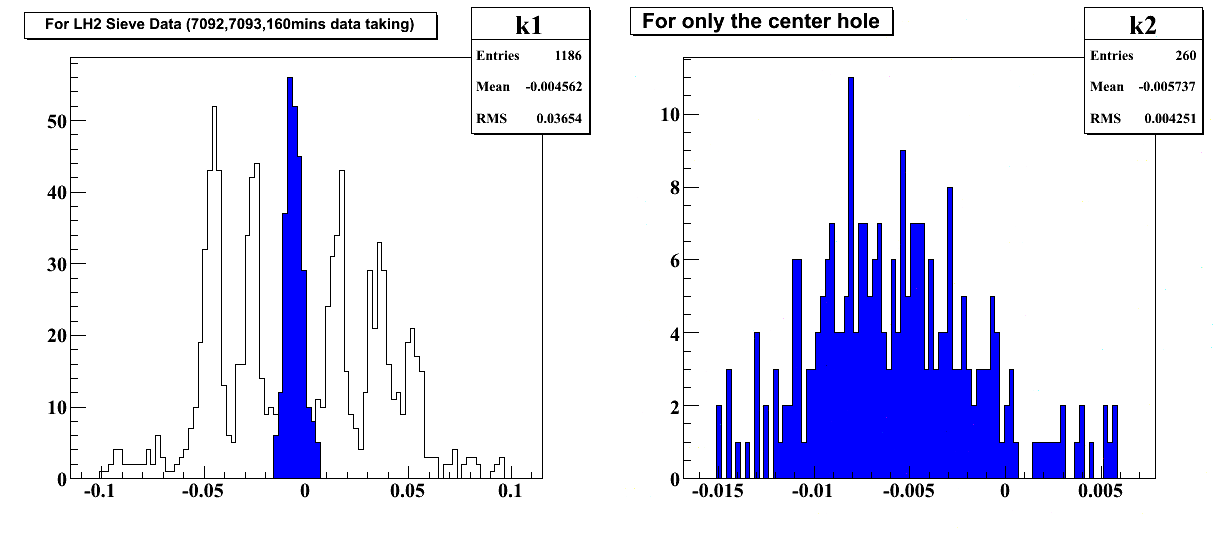
I plot Fg.3 to give roughly the statistics for experts to determine future plan.
Fg.1 Pion cut
Fg.2 LH2 and Carbon Sieve
Fg.3 Statistic