Make New Entry, Make Followup Entry
User name miham
Log entry time 12:21:56 on May 20, 2009
Entry number 275052
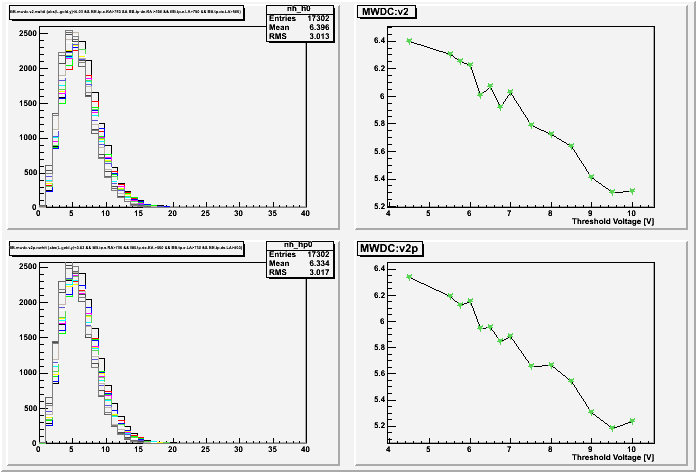
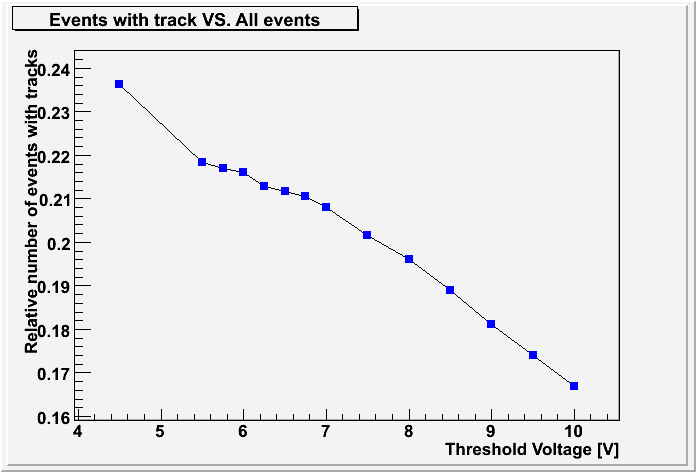
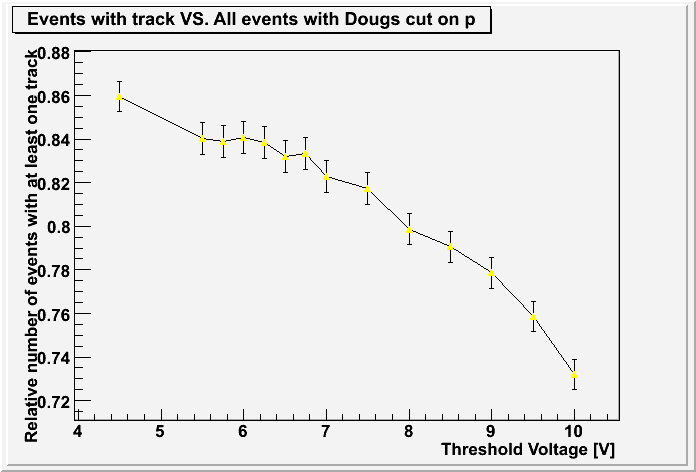
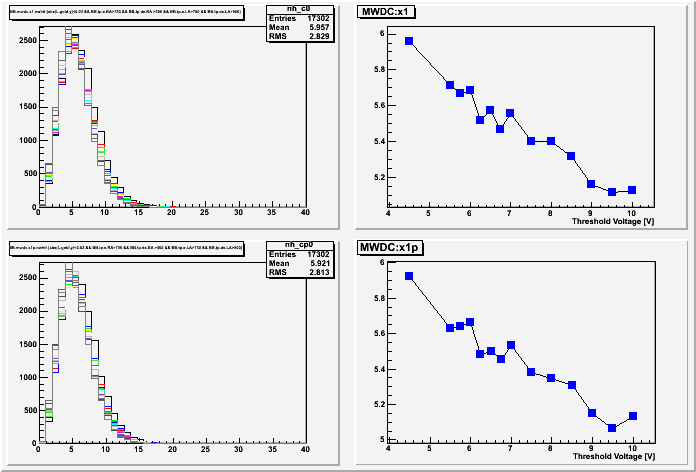
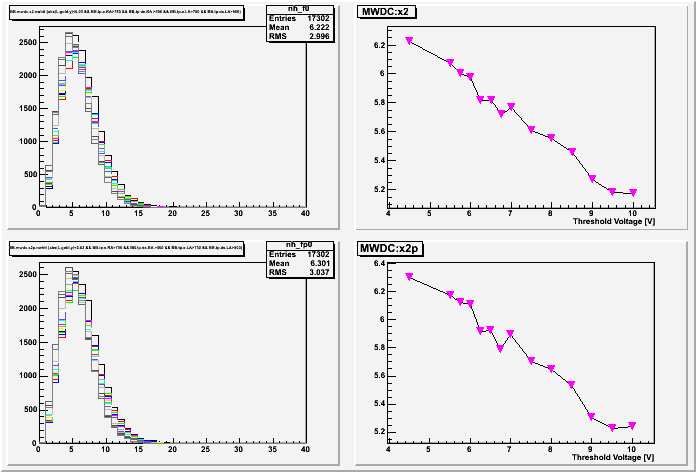
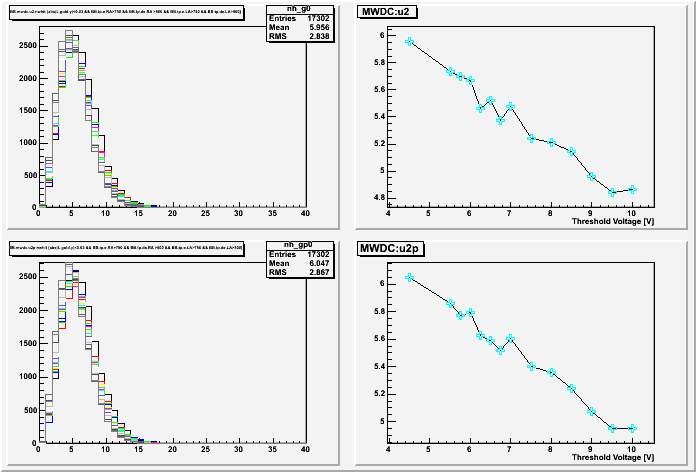
keyword=MWDC Threshold scan resultsDuring the weekend we made two BB MWDC threshold scans in order to determine, how the number of reconstructed tracks and number of hit wires changes with the set threshold. Here are the run numbers and set thresholds for all the runs that we have taken: 1st scan: ========= Run # | No. ev. | DT | Front Th. | Back Th. ---------------------------------------------------- 2369 | 5M | 11% | 5.5 V | 5.5V 2370 | 500k | 11% | 6.0 V | 6.0V 2371 | 600k | 11% | 6.5 V | 6.5V 2372 | 500k | 11% | 7.0 V | 7.0V 2nd scan: ========= Run # | No. ev. | DT | Front Th. | Back Th. ---------------------------------------------------- 2390 | 500k | 11% | 7.5 V | 7.5 V 2391 | 500k | 12% | 8.0 V | 8.0 V 2392 | 500k | 11% | 8.5 V | 8.5 V 2393 | 500k | 11% | 9.0 V | 9.0 V 2394 | 500k | 11% | 9.5 V | 9.5 V 2395 | 500k | 11% | 10.0 V | 10.0 V 2396 | 500k | 11% | 6.75 V | 6.75 V 2397 | 500k | 11% | 6.25 V | 6.25 V 2398 | 500k | 11% | 5.75 V | 5.75 V Results: ======== 1.) First plot shows the distribution of number of found tracks for each event. 2.) Second plot shows how relative number of events that have at least one track changes with the set threshold. 3.) Third plot shows how relative number of events that have at least one track changes with the set threshold. In this case I used Dougs cut on the protons: TCut doug1 = "abs(L.gold.y)<0.03 && BB.tp.e.RA>750 && BB.tp.de.RA >500 && BB.tp.e.LA>750 && BB.tp.de.LA>500"; which basically demands that particles must come out of the target and that they must deposit enough energy in the paddles (this can be only protons or deuterons). 4.) The rest of the plots show how the mean number of wires that had at least one hit, changes with the set threshol. I have made plots for all 12 wire planes and in all the plots I considered Dougs strict cut.
A copy of this log entry has been emailed to: doug, sirca, gjin
Number of reconstructed tracks per event

Relative number of events with tracks
Relative number of events with tracks (Dougs Cut)
Mean number of wires hit x1 and x1p
Mean number of wires hit u1 and u1p

Mean number of wires hit v1 and v1p

Mean number of wires hit x2 and x2p
Mean number of wires hit u2 and u2p
Mean number of wires hit v2 and v2p