Make New Entry, Make Followup Entry
User name igorko
Log entry time 00:31:27 on March 28, 2011
Entry number 353428
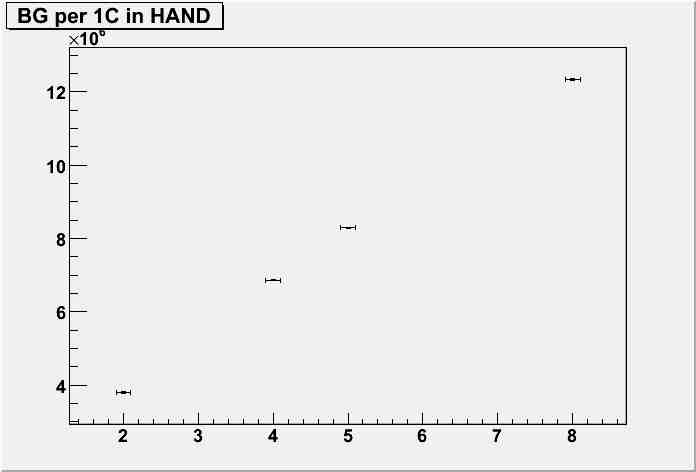
keyword=currents cont.comparation for different currents. I modified the region of the peak for HAND and made the same plots again ( as in HALOG 353419). In addition I added 2 plots (one for BB and one for HAND) that show BG dependence on the currents.
A copy of this log entry has been emailed to: eip,doug,orchen,sgilad@mit.edu,vasulk,rshneor,jwatson@kent.edu,jixie
Figure 1
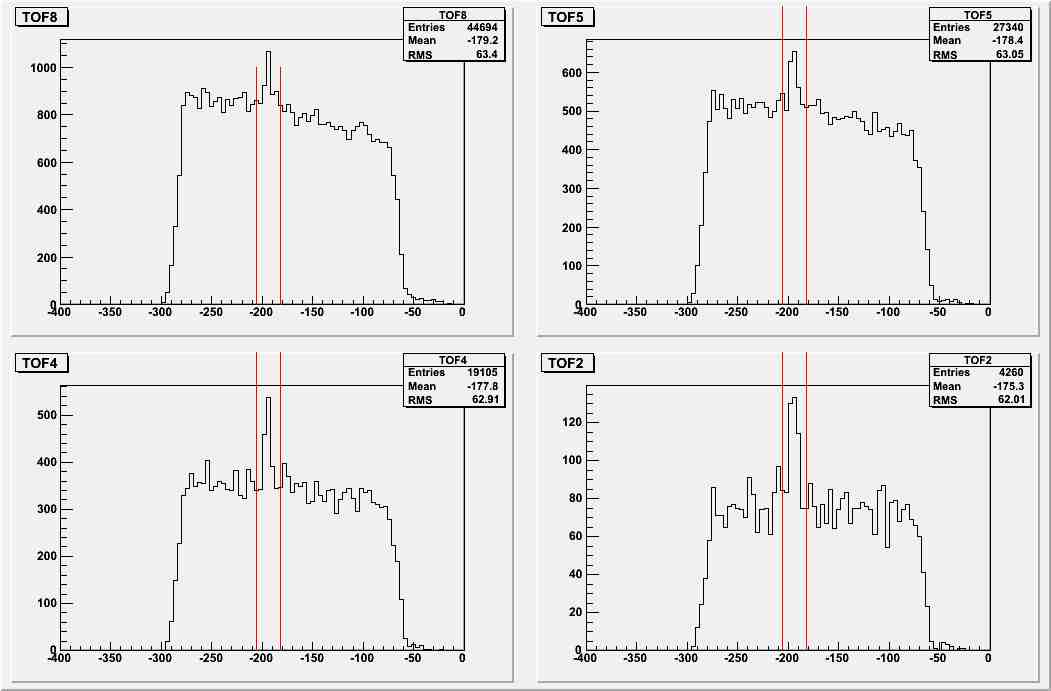
Figure 2
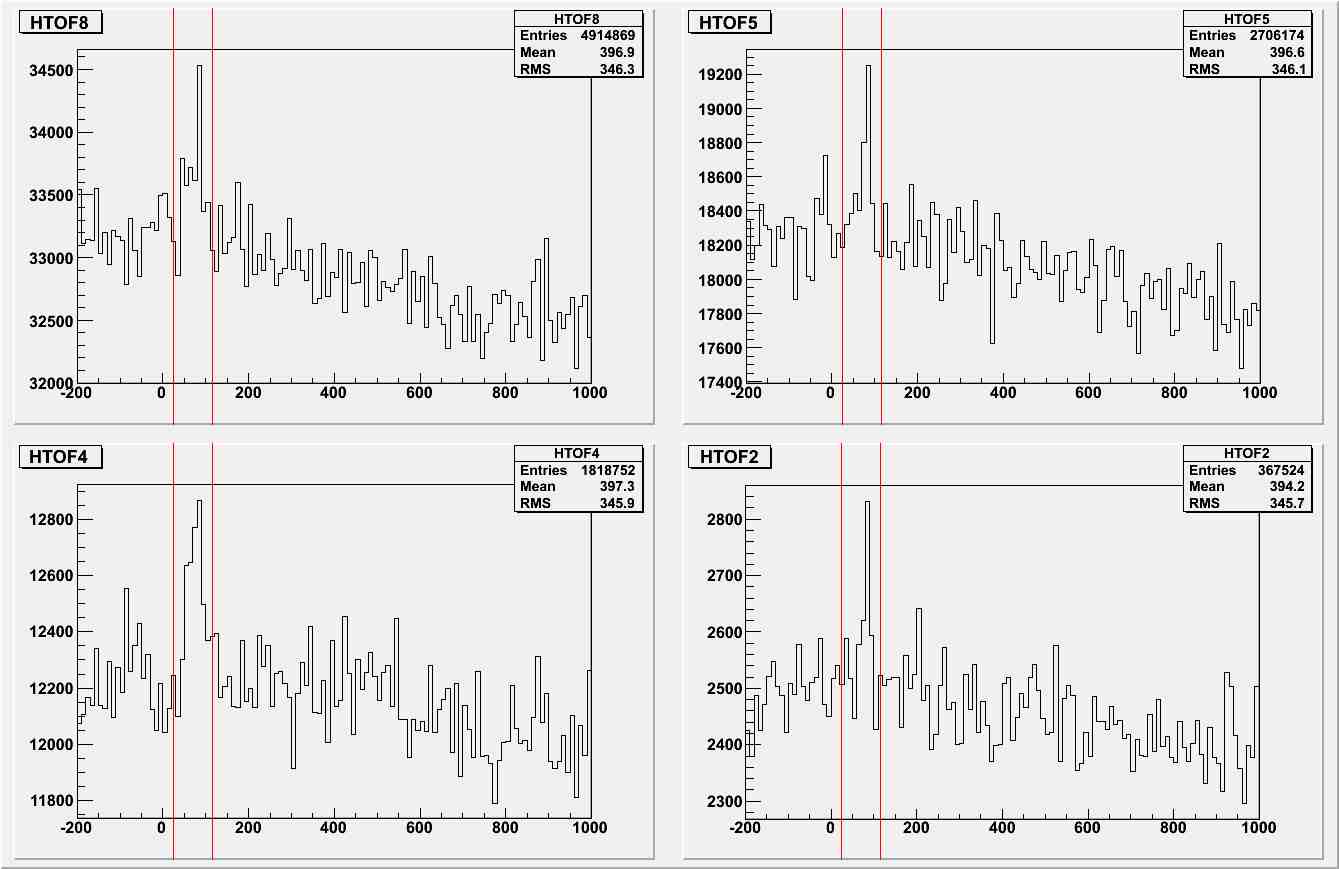
Figure 3
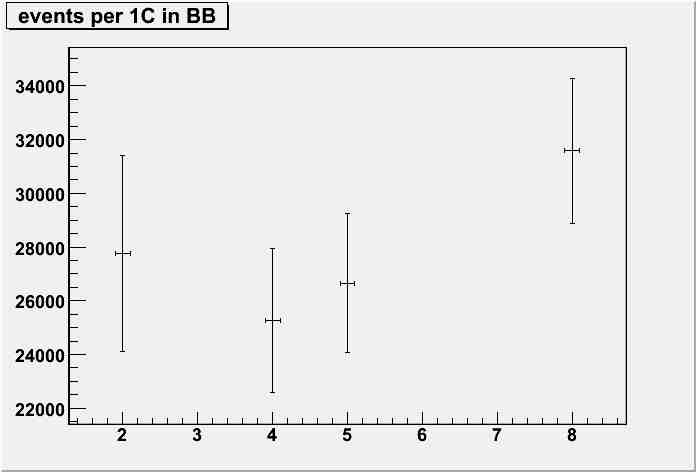
Figure 4
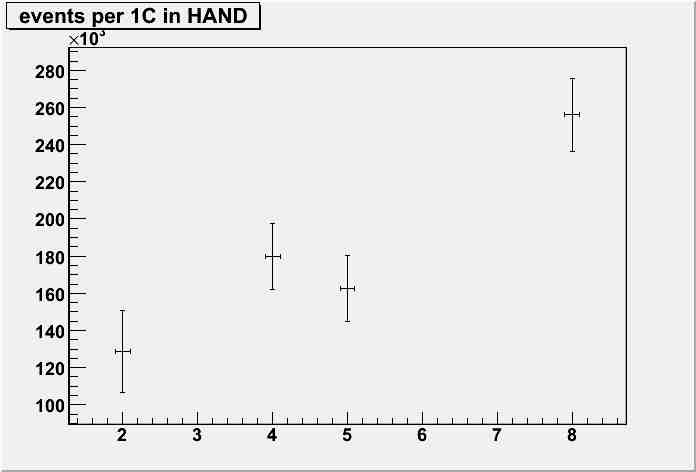
Figure 5
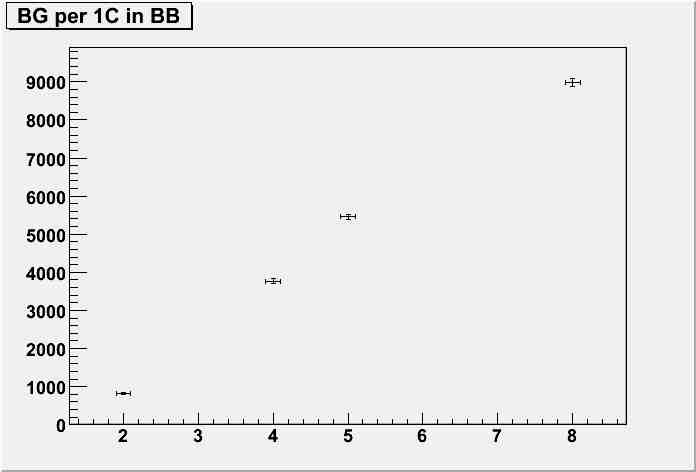
Figure 6