Make New Entry, Make Followup Entry
User name V. Sulkosky
Log entry time 18:57:58 on March 29, 2011
Entry number 353629
Followups:
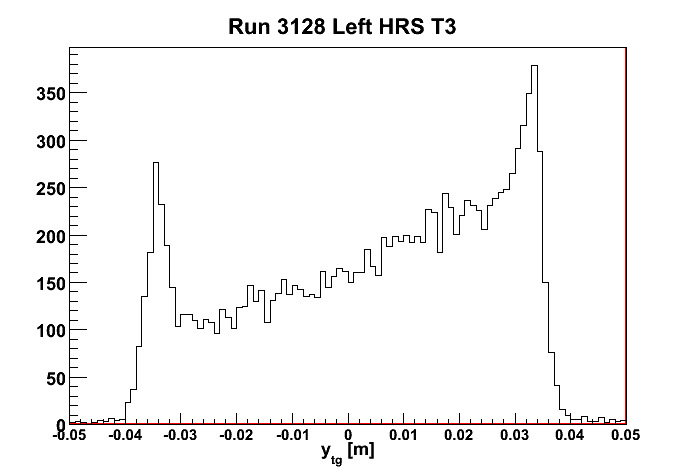
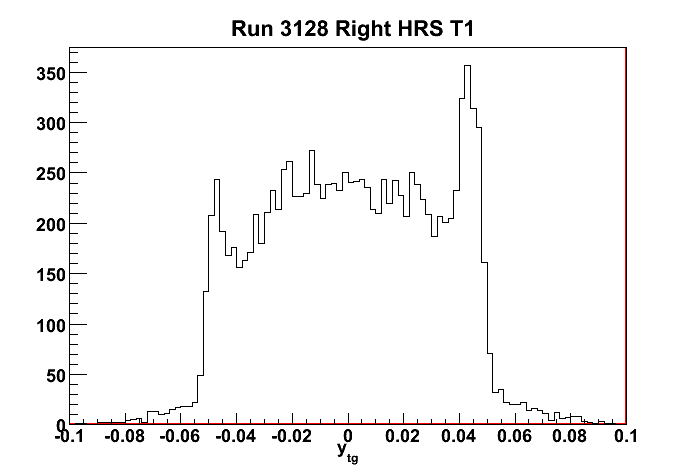
keyword=Target windows for LHRS and RHRSFigures 1 and 2 show the ytg distribution for both left HRS and right HRS, respectively. Clearly we can see the windows for both, though in these plots I cut on the respective HRS triggers. If I cut on T5, I also see hints of the windows as well, though the statistics for a single run are too low to show clearly. If one were to chain several runs together, then you could see those as well for the T5 coincidence trigger.
A copy of this log entry has been emailed to: doug,orchen,igorko,rshneor,eip@tauphy.tau.ac.il,sgilad@mit.edu,n.muangma@gmail.com
Ytg for 20 cm 4He LHRS

Ytg for 20 cm 4He RHRS
