Difference between revisions of "Polarization Display Panel (PDP) Overview"
(→Baseline Dialog) |
(→Baseline Dialog) |
||
| Line 64: | Line 64: | ||
The baseline dialog allows you to run with no baseline, take a new baseline, or select a previously taken baseline, which it shows you graphically arranged by date. The baseline created for the current material should be posted to the Hall C log, and noted in the logbook. | The baseline dialog allows you to run with no baseline, take a new baseline, or select a previously taken baseline, which it shows you graphically arranged by date. The baseline created for the current material should be posted to the Hall C log, and noted in the logbook. | ||
| − | See [[New Baseline | + | See [[New Baseline Procedure|Taking a Baseline]]. |
==Target Motion Dialog== | ==Target Motion Dialog== | ||
Revision as of 15:04, 15 September 2011
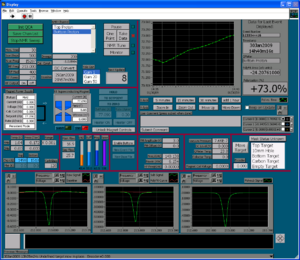
The Polarization Display Panel is the main user interface for the UVa polarized target. PDP is also the hub of a messaging system by which all the other target LabView programs communicate. While there are many windows that open when you click "TPS Start", PDP is the one that will control all the others for you. PDP puts nearly everything the operator needs to watch in from of him/her, and allows control of the NMR system and magnet power supply. While intimidating at first, PDP consists of a just a few panels to keep track of. Here they are arranged by function.
Contents
NMR Control and Analysis
NMR Control Panel
The NMR control panel is at the top left of PDP. Most of the values will be set automatically by text file configuration scripts when PDP starts.
- Init buttons: These are green buttons used to re-initialized the NMR system from configuration files. Save Chan List will save the current settings including the calibration constant. If you restart the program, the values saved will be loaded upon start-up. Try it.
- NMR Values: These grey text boxes are set from config files. They display information about the NMR sweeps and scans of RF used to measure polarization.
- NMR Channel: This is a selection box that allows you to choose which target cup to run the NMR system on. If the Top target is in place, you'll select Top Proton.
- Sweeps: This is the number of times the NMR system should sweep through the RF range to acquire the NMR signal. The sweeps are averaged, so the more sweeps, the more time it takes, but the lower the noise will be in the signal.
- Cal. Constant: The calibration constant is used to scale the final NMR signal area into a Polarization percentage. This number is set by performing a "TE" thermal equilibrium calculation.
- DC Convert: The NMR signal can acquire a DC offset, which you can see when the signal drifts away from the baseline. Clicking this will reset the DC offset. It is best not to push this while taking data, as the reset will skew the sweep average. Use this in "NMR Tune" mode.
- Baseline: This is the baseline file we are using. The baseline is the NMR signal with the magnetic field moved away from the resonant (Larmor) frequency of the proton. A baseline should be a clean Q curve, which we use to subtract away systematic noise. By clicking the baseline button the Baseline Dialog will appear.
- Yale Gain: This is a gain scaling. We use this to find the tiny TE signal when polarization is low. Once the polarization increases, we need to lower the gain to prevent electronic cropping.
- Mode Buttons: These buttons are used to change the PDP's current mode. Here are the modes and what they mean:
- Pause is what it sounds like. PDP will finish the current set of sweeps and finish.
- One Point takes one set of NMR sweeps and goes to Pause. Useful for baselines.
- Take Data continues taking new sets of NMR sweeps until you push Pause.
- NMR Tune cause the RF sweeps to go continuously without monitoring the output. Used during Tuning when we don't need to save the curve, but want to be able to see it to tune it.
- Monitor takes data from all the other modules, such as the Magnet Control and Slow Controls, so that the system state can be written to Epics and the Event File without needing to acquire a Q curve. Used to monitor the system when we aren't taking data. The "Mon. Time" under the NMR values sets how long PDP waits before requesting more state data. A good values is 20 or 30 seconds.
Event View
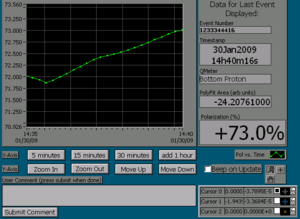
In the upper right of PDP, this panel displays the polarization over time, and some Event information for the current event.
- Polarization Display: Shows the polarization over time. Using the X and Y axis controls, you can view the data over 5, 15, or 30 minutes (and add an hour to any of those times), and zoom or shift in Y.
- Comment Box: Feel free to put any user comments about the event here, though we may not use them.
Signal View
Across the bottom of PDP are views of the NMR signal. The 3 graphs show the signal after various alterations.
- Raw and Baseline Signal: To the left, the baseline signal is shown in red, and the raw NMR signal in green.
- Subtracted and Poly Fit: In the middle is a subtracted signal in green, with the baseline subtracted from the raw NMR signal. In red is a polynomial fit to this subtracted signal, which we use to subtract out any extra signal drift that the baseline didn't remove.
- PolySub Signal: To the right is the polynomial subtracted signal, which should show our pure signal. The area of this signal is proportional to the polarization of our material, via a calibration factor.
File Buttons
In the very middle of PDP is a small panel with file operation buttons. Click "Enable Buttons" to turn on these buttons. "New Event File" creates a new file for storing all target data. "New Base File" creates a new file to hold the baseline signal.
Magnet Control
Allows monitoring and control of the magnet. Since only experts will control the magnet, we won't go into this.
Status Monitors
In the middle are several panels that show the system status.
- Insert and Nose Temps: The far left shows temperatures and pressures on the insert and in the nose.
- Flows and Levels: Next are flow indicators of the fridge and separator, and liquid levels in pretty colors. If they get too low, do something.
- Microwave Values: Show the FM amplitude, offset, and the Frequency and power of the microwaves that induce polarization.
- Misc Values: Lastly, these show the vacuum pressure (visible on the other target screen as well), and two important temperatures: the Q-meters and the Collector. The collector on the microwave tube is interlocked so a high temp will cut it off.
Target Motion
Right middle, this shows the target location as an encoder value and selection box. The "Move Target" button brings up the target motion dialog. The target mask status is also show, but only updates in monitor or take data mode. The encoder will read 0.000 upon restart, until you click move target and done, when it will retrieve the correct value.
Baseline Dialog
The baseline dialog allows you to run with no baseline, take a new baseline, or select a previously taken baseline, which it shows you graphically arranged by date. The baseline created for the current material should be posted to the Hall C log, and noted in the logbook.
See Taking a Baseline.
Target Motion Dialog
You need to HOLD down the Up or Down button to get the target to move!


