Difference between revisions of "Study of UV Curing"
(→Systematic Error) |
|||
| (15 intermediate revisions by 2 users not shown) | |||
| Line 10: | Line 10: | ||
==Intro and lamps to be used== | ==Intro and lamps to be used== | ||
| − | The lead glass bleaching process with UV light was used during the GEp(3) experiment and is extensively used in many other experiments. Due to the radiation conditions expected in GEp(5), a cleaning rate 5 times faster than GEp(3) is required. | + | The lead glass bleaching process with UV light was used during the GEp(3) experiment and is extensively used in many other experiments [http://www.sciencedirect.com/science/article/pii/0168900293907476][http://www.sciencedirect.com/science/article/pii/S0168900298007487][http://www.sciencedirect.com/science/article/pii/S0168900211005729]. Due to the radiation conditions expected in GEp(5), a cleaning rate >5 times faster than GEp(3) is required[http://www.jlab.org/exp_prog/proposals/07/PR12-07-109.pdf]. |
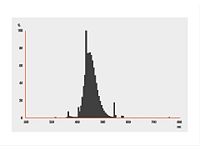
The first step was change the kind of lamp used. In GEp(3) was used OSRAM DULUX/L 24W/67. The code 67 indicates the OSRAM 'color' code of the lamp. The emission spectra from this lamp shows that the maximum emission is around 460 nm, with a small tail in the UV region (see figure 1). [[Image:OSRAMColor67.jpg|200px|thumb|left|Fig.1 Color 67 Emission Spectra]] | The first step was change the kind of lamp used. In GEp(3) was used OSRAM DULUX/L 24W/67. The code 67 indicates the OSRAM 'color' code of the lamp. The emission spectra from this lamp shows that the maximum emission is around 460 nm, with a small tail in the UV region (see figure 1). [[Image:OSRAMColor67.jpg|200px|thumb|left|Fig.1 Color 67 Emission Spectra]] | ||
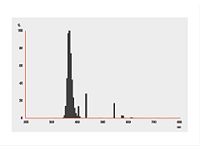
| − | The cleaning process with UV light is based in the annihilation of Color Centers. For this, it is necessary make use of light with energy photon higher than the energy of the color center | + | The cleaning process with UV light is based in the annihilation of Color Centers (defects or impurities, in form of electrons or holes, within the lattice, which are optically active[http://www.sciencedirect.com/science/article/pii/0029554X73906447]). [[Image:OSRAMColor78.jpg|200px|thumb|right|Fig. 2 Color 78 Emission Spectra]] For this, it is necessary make use of light with energy photon higher than the energy of the color center[http://www.sciencedirect.com/science/article/pii/0168900293907476]. Although the study has not been done yet, it is know that threshold of such Color Centers is in the UV region. Since the GEp(3) lamp has a total power output in the UV region of 50mW, the first step is looking for commercial with higher total power output in the UV region. |
| − | |||
| + | The most inexpensive and faster option is the OSRAM DULUX/L 18W/78. With this lamp it is not necessary huge inversion since the socket and ballast used is the same as the GEp(3) lamp. The emission spectra of this lamp shows a maximum close to 370 nm with a total power output of 3W in the UV region (see figure 2). | ||
| + | |||
| + | |||
| + | == Idaho Bars == | ||
| + | [[Idaho bars - First test]] | ||
| + | |||
| + | [[Idaho bars - Second test]] | ||
| + | |||
| + | == Yerevan Bars == | ||
| + | |||
| + | [[Yerevan bars - Test]] | ||
== Preliminary measurements == | == Preliminary measurements == | ||
| Line 24: | Line 34: | ||
| − | February 18th and 19th, 4 bars from GEp3, one from Mark's | + | February 18th and 19th, 4 bars from GEp3, one from Mark's prototype, and 2 bar irradiated in Idaho were measured their trasmission, longitudinal and transversally. |
Yerevan 01 longitudinal | Yerevan 01 longitudinal | ||
| Line 70: | Line 80: | ||
=== Systematic Error === | === Systematic Error === | ||
Below is a plot of the residual (deviation) caused by the systematic error in the transmisstivity measuring setup. | Below is a plot of the residual (deviation) caused by the systematic error in the transmisstivity measuring setup. | ||
| − | [[Image: | + | [[Image:Residual_from_transmisstivity_setup_1.png]] |
| − | To find the residuals we took 14 data runs from the undamaged portion of P04 (25cm and 30cm). | + | To find the residuals we took 14 data runs from the undamaged portion of P04 (25cm and 30cm). The residual was calculated for each wavelength (<math>\widehat{\varepsilon}_i=T_i-\overline{T}.</math>). The histogram above contains the residuals of each point for all 14 runs from 340nm-600nm, it was then fit with a Gaussian. |
Latest revision as of 14:02, 18 July 2014
Study of UV Curing
Contents
Work in the Hall
- May 5th during the beam studies, placed 5 lead glass bars in Hall A on the beam left spectrometer. They are placed on a ledge on the small angle side near Q2.
Bleaching Lead Glass bars
Intro and lamps to be used
The lead glass bleaching process with UV light was used during the GEp(3) experiment and is extensively used in many other experiments [1][2][3]. Due to the radiation conditions expected in GEp(5), a cleaning rate >5 times faster than GEp(3) is required[4].
The first step was change the kind of lamp used. In GEp(3) was used OSRAM DULUX/L 24W/67. The code 67 indicates the OSRAM 'color' code of the lamp. The emission spectra from this lamp shows that the maximum emission is around 460 nm, with a small tail in the UV region (see figure 1). The cleaning process with UV light is based in the annihilation of Color Centers (defects or impurities, in form of electrons or holes, within the lattice, which are optically active[5]). For this, it is necessary make use of light with energy photon higher than the energy of the color center[6]. Although the study has not been done yet, it is know that threshold of such Color Centers is in the UV region. Since the GEp(3) lamp has a total power output in the UV region of 50mW, the first step is looking for commercial with higher total power output in the UV region.
The most inexpensive and faster option is the OSRAM DULUX/L 18W/78. With this lamp it is not necessary huge inversion since the socket and ballast used is the same as the GEp(3) lamp. The emission spectra of this lamp shows a maximum close to 370 nm with a total power output of 3W in the UV region (see figure 2).
Idaho Bars
Yerevan Bars
Preliminary measurements
February 18th and 19th, 4 bars from GEp3, one from Mark's prototype, and 2 bar irradiated in Idaho were measured their trasmission, longitudinal and transversally.
Systematic Error
Below is a plot of the residual (deviation) caused by the systematic error in the transmisstivity measuring setup.

To find the residuals we took 14 data runs from the undamaged portion of P04 (25cm and 30cm). The residual was calculated for each wavelength (<math>\widehat{\varepsilon}_i=T_i-\overline{T}.</math>). The histogram above contains the residuals of each point for all 14 runs from 340nm-600nm, it was then fit with a Gaussian.


