Difference between revisions of "Sep 2, 2019"
From Hall A Wiki
| Line 12: | Line 12: | ||
Agenda: | Agenda: | ||
| − | Meeting canceled but summary here | + | Meeting canceled but summary of weekend measurements here. |
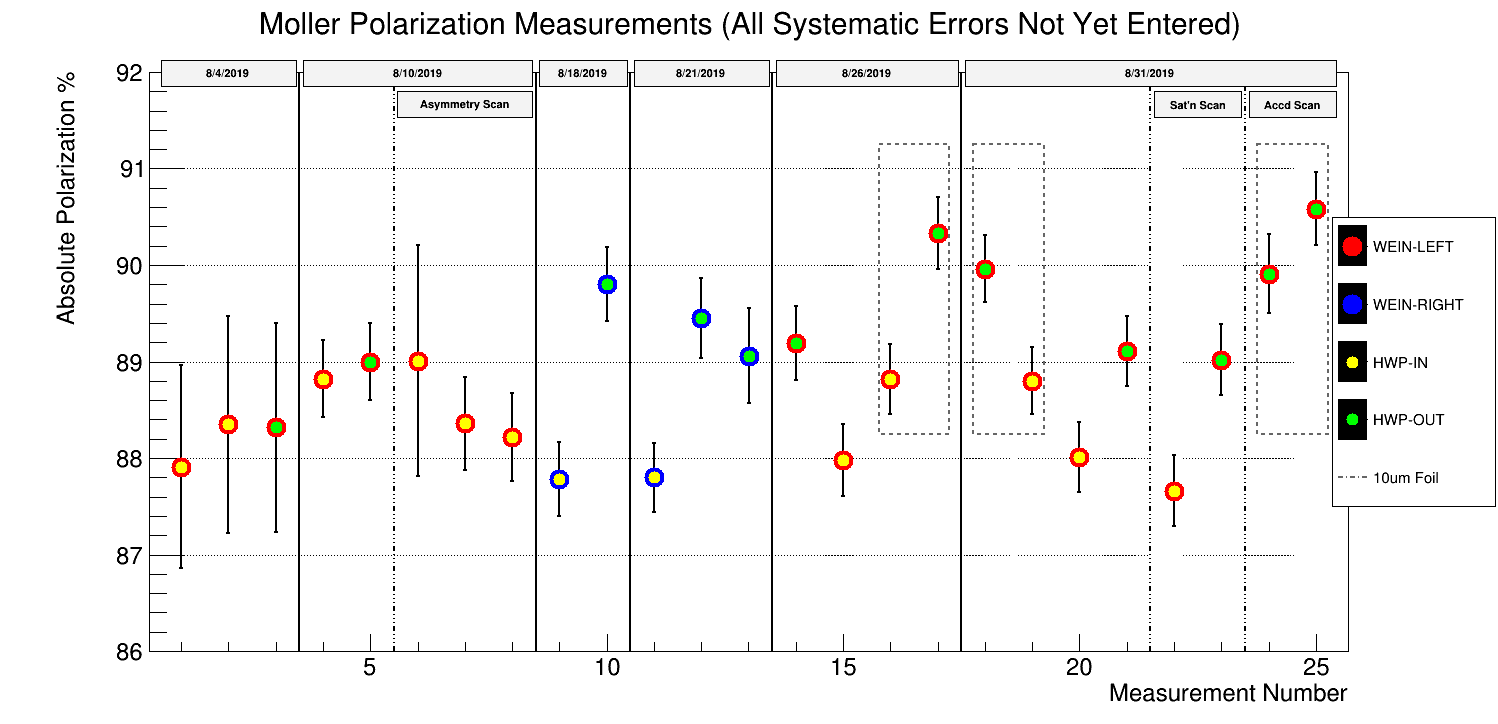
*We have had a rather large but stable HWP In/Out difference of 1.3% for the past few measurements (see Figure 1 put together by Eric). | *We have had a rather large but stable HWP In/Out difference of 1.3% for the past few measurements (see Figure 1 put together by Eric). | ||
*We previously thought that the difference showed up after Aug 10, because In and Out were statistically equal before that (measurements 1-5 on Figure 1 or see Figure 2 also by Eric). However, statistically the In and Out measurements separately are each separately consistent with a constant polarization at the <0.15% level including all the August data. | *We previously thought that the difference showed up after Aug 10, because In and Out were statistically equal before that (measurements 1-5 on Figure 1 or see Figure 2 also by Eric). However, statistically the In and Out measurements separately are each separately consistent with a constant polarization at the <0.15% level including all the August data. | ||
Latest revision as of 09:17, 16 September 2019
Back to Main Page >> Moller Page >> Moller Weekly Meeting Index
previous meeting << >> following meeting
Original Moller Polarimeter Page
Agenda: Meeting canceled but summary of weekend measurements here.
- We have had a rather large but stable HWP In/Out difference of 1.3% for the past few measurements (see Figure 1 put together by Eric).
- We previously thought that the difference showed up after Aug 10, because In and Out were statistically equal before that (measurements 1-5 on Figure 1 or see Figure 2 also by Eric). However, statistically the In and Out measurements separately are each separately consistent with a constant polarization at the <0.15% level including all the August data.
- One theory was that incomplete sampling of the beam at the slit produced the In/Out difference. Bleedthrough from Hall B was 0.09% with the slit wide open (https://logbooks.jlab.org/entry/3726830) so we were able to test this idea by taking runs wide open. However the In/Out difference persists even when the slit is wide open (https://logbooks.jlab.org/entry/3726860)
- With both Compton and Moller measuring In/Out differences, it would be nice to have a precision Mott measurement to see if it shows up in the source.
- While the In+Out null is non-zero, the null asymmetry on Cu continues to be 0 with precision 0.2% https://logbooks.jlab.org/entry/3726892 https://logbooks.jlab.org/entry/3726906
- The 10 micron Fe foil continues to measure ~1% higher polarization than the 4 micron foil (see attachment 1). Most of the systematic effects that I have considered are expected to reduce the polarization making me inclined to believe the higher number. This requires further thinking. It will be interesting to compare final numbers between Mott, Moller and Compton. I hope the teams can be blind to each other's results.
- One idea for the foil difference was that the 4 micron foil suffers from misalignment or wrinkles. A bound was placed on this hypothesis when we lowered the target holding field from the usual 4 T to 3.5 T and measured polarizations that were statistically consistent at the 0.3% level (measurements 22 and 23 in Figure 1).
- Another idea to explain the foil difference was that last time (Aug 26 which was the first day we took precision data on the 10 micron foil) we ran at a lower Q1 field that put us closer to the Levchuk "peak" and that the 10 micron foil was radiated down further into this region than the 4 micron. (For those not following closely, we always do a Q1 (quad 1) rate scan and set Q1 at 3.5% above the rate max current. Simulation tells us that this method of setting up relative to Q1 max puts us in a flat region of Azz far from with a small Levchuk correction. This usually means setting Q1 to about 130 amps. However, on Aug 26 we had an anomalous rate scan measurement that prompted us to set Q1 at 125 A. We still can't explain the reason for this anomaly.) To test this idea of a large Levchuk, we did separate Q1 scans for both the 4 and 10 micron foils. However, no difference was observed in the rate max position and both analyses called for setting Q1 at 130 A again. Another hypothesis buried. However, the difference in polarizations measured persisted at the 0.8% level.
- To measure rate dependent effects we took a series of LED runs were 4kHz of LED pulses are fed into the detectors in coincidence. The current is then varied and the number of these LED pulses that are missing is tallied for each current. A linear relationship was measured as expected with a deadtime of about 0.5% per muA observed on the 10 micron foil https://logbooks.jlab.org/files/2019/08/3726947/deadtime_measurements.pdf
 Figure 1. Polarizations separated by HWP state and foil.
 Figure 2. Sign-corrected polarizations over time.
Connection details:
Meeting URL https://bluejeans.com/388466836
Meeting ID 388 466 836
US toll free phone 1.888.240.2560
Dial in, type in the meeting ID and then press ##
Minutes