Left HRS Scintillator Timing
Contents
Initial Time Offset Calibration
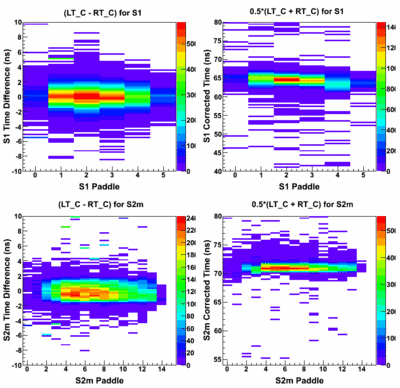
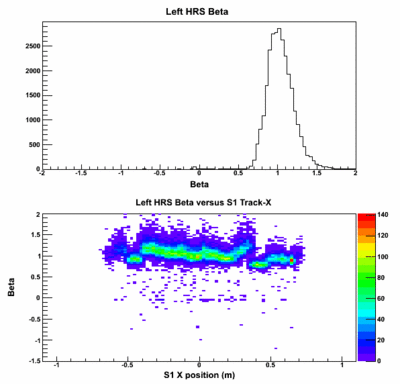
S1 and S2m time difference and corrected time plots for run 2512 after initial time offset calibration:
The left figure shows that the time differences are fairly well calibrated, but the corrected times show some shifts
for a few paddles in S1 and S2m. The beta spectrum shows some discontinuities that I thought might be related to
the time offset shifts. I will present more on this in the discussion below. The beta spectrum has a long tail for beta greater than 1, and the beta resolution is about 0.14.
Second Iteration
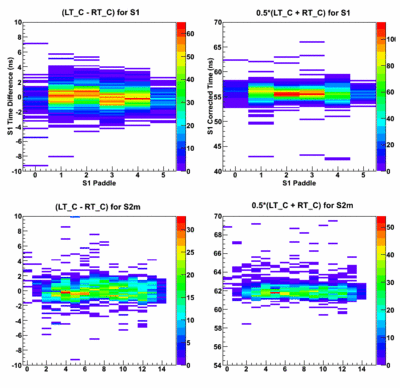
For the second iteration, I decided to look at a recent production run: 3789.
In this iteration, I fine-tuned the time offsets to improve the corrected time between paddles to remove the remaining
shifts from the previous iteration. The figures on the left show the time versus paddle for S1 and S2m are now
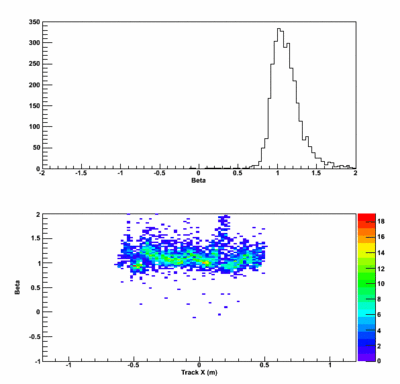
much improved over the first iteration. The resolution of the beta spectrum has improved to about 0.116.
However, we still see that the resolution in beta is limited by the discontinuities seen in the beta versus track x
plot.
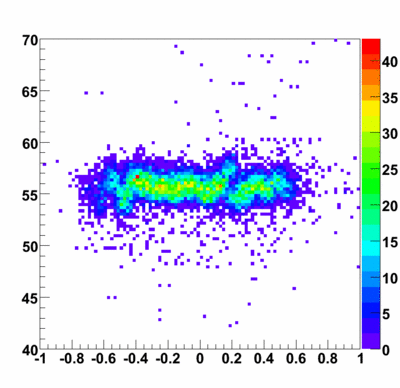
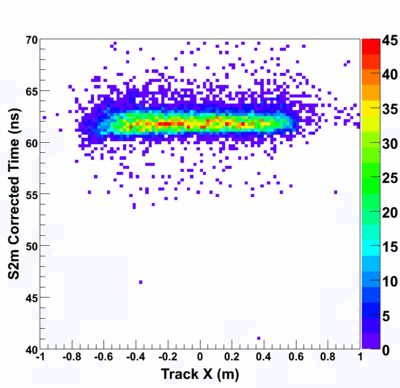
At this point, I was puzzled by these discontinuities and decided to look at the S1 and S2m corrected times versus the track x position.
The left plot (unfortunately not labeled) and the right plot show the corrected S1 and S2m times, respectively. The discontinuities seen in the beta spectrum are clearly due to the problems seen in the S1 spectra. The timing from S2m is very good and has sub-nanosecond resolution already.
Scintillator Timing Resolutions (at this point)
The following figure shows the S1 and S2m timing resolution with time offset corrections. The S1 resolution is about 1.05 ns, and the S2m resolution is 640 ps. With more fine tuning and adding the time-walk corrections, the S2m time resolution should get better. Until the S1 problem is fixed, it will remain about 1 ns.
S1 Timing Distribution
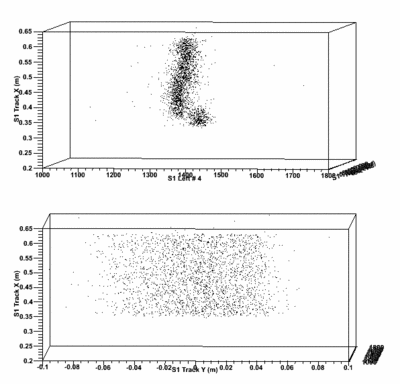
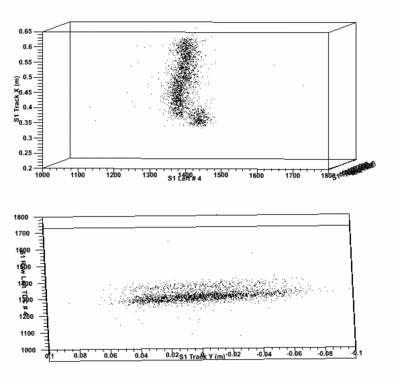
The two distinct timing shifts seen in the S1 scintillator are isolated to the second and fifth paddles. In an attempt to understand the problem, I looked at the timing from these paddles versus the track-X and Y positions projected to the scintillator plane. I found that the timing difference was in the raw TDC histograms, so the following plots show the S1 left PMT #5 (index 4) raw TDC channel versus S1 track-X and Y.
The left figure shows the S1 track-X position versus raw TDC channel with the axis into the page the S1 track-Y position. This figure clearly shows that the TDC time has a strong correlation with track-X. The bottom plot shows
the S1 track-X position versus the track-Y position. There is no strong correlation here. For the figure on the right hand side, the top image is a repeat of the left side. The bottom plot shows the raw TDC channel versus the track-Y position. I have rotated the image so you can still see the correlation with track-X. Clearly
there is no correlation along the paddle (track-Y), but there is distinct shadow indicating the correlation with the X
position.
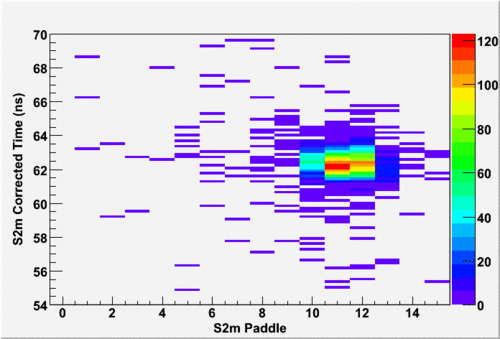
I began to consult with Seamus on the time shifts within the S1 paddles. He suggested to look for a correlation with another detector, especially S2m. I found that for events coming from a specific S1 paddle, there are typical four to five paddles in S2m that fire. However only three of these paddles contain the majority of the hits. The following figure shows the S2m corrected time versus S2m paddle for events that fired S1 paddle number 5. Clearly S2m paddles 10 through 13 fire for events hitting S1 paddle 5.
I then started to look for correlations between the timing from S2m versus the timing from S1. Seamus believed that the internal S1 paddle time shifts might be due jitter in the S2m paddle trigger times. S2m is ultimately what determines the trigger time in the left HRS.
The following figure shows time in nanoseconds versus S2m paddle number:
In this figure, I have three different times. The time indicated with the red letters shows the S2m raw TDC times without any corrections. We clearly see about 7 ns of difference between the paddles. I then plotted the S2m corrected times indicated by the blue text. Clearly the time offsets have been done fairly well for S2m with perhaps small tweaks needed near the edge of the acceptance. Finally the green text indicates the S1 corrected time. I haven't plotted the S1 time versus S2m paddle before this, but the time shifts in S1 are clearly correlated to a specific S2m paddle.
The S1 time substructure is apparently due to time jitter between the S2m paddles that eventually form the T3 trigger time. The left HRS T3 time is closely tied to the timing for the right-side of S2m, since this side is self-timing. Ideally all the S2m trigger cables on the right side are the same length and all electronic channels have the same delay, but clearly they are not and lead to the sub-structure seen in the S1 timing. This can be corrected in software with a special correction. However this should not matter for the coincidence time, and only affects the left HRS beta spectrum.
