Week Four
16 June:
Rate of coincidence events is quite low for the scintillators. Considering moving them closer together, but would need to deconstruct the stand. FEC Ch. 0 still giving anomalous data. This APV is likely unusable in the files from the 13th. Going to try swapping APVs and HDMI cables to see if the problem is hardware based. Attempts to restart the SRS system, swap cables and APVs all yielded no effect. Problem has to be a software issue. Not sure though where the issue is occurring.
17 June:
Lucky guess appears to have paid off. Tried making some artificial changes to the mapping and move the APVs to FEC Channels 2-7 instead of 0-5, then place two non-existent APVs in Channels 0 and 1. Though there is nothing actually connected to the ADC at Channels 0 and 1 data from Ch. 0 still appears exactly the same, while Ch. 2 (which was the APV formally at Ch. 0 appears perfectly fine). I'm guessing that the data I was getting at Ch. 0 was good, just being displayed incorrectly. Going to try taking some long exposure data runs. Files:
Jun17Ped:/HV(g):2000/HV(p):700/Cosmics/1000e
Jun17Run1:/HV(g):4000/HV(p):700/Cosmics/unsure how many events recorded(possibly rewritten by accident)
Jun17Run2:/HV(g):4000/HV(p):700/Cosmics/50,000e
18 June:
Going to change the stand, so I can get a higher cosmic rate. New setup pictured in notebook. Rate has improved slightly. Average trigger rate moved from 0.343 to 0.743 Hz. After digging, also discovered the error in the code. When SRSPublisher calls SRSFECEventDecoder from the MonitorEvent function it does not tell it the number of actual APVs. So Amore is trying to fill histograms with data from blank channels (in the case of Raw Data). For pedestal analysis this caused a complete crash because the fill functions were trying to give data to histograms that weren't booked (i.e. created). Should now be working.
19 June:
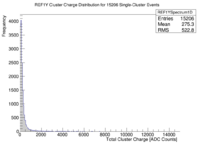
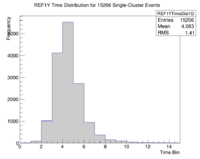
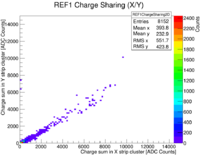
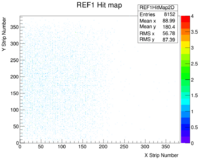
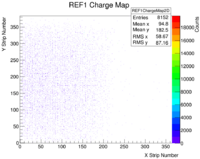
2D plots still throwing errors. Not caused by code (sorta). Plots are too large for mysql server objects (not sure why or how this limit is set). So they can't be monitored (or subscribed to) during the actual analysis, but they are being filled correctly. They can be viewed at the end of a run once the histos have been saved to a root file. Unfortunately the plots look a bit sparse since the X-plane doesn't see as many events as the Y-plane. Plots from Jun19Run2 file uploaded below (Single cluster multiplicity cut in both planes applied to 2D plots):
Taking more data, because it can't hurt to have:
Jun19Ped:/HV(g):2000/HV(p):700/Cosmics/1000e
Jun19Run1:/HV(g):4000/HV(p):700/Cosmics/17,196e
June19Run2:/HV(g):4000/HV(p):700/Cosmics/50,000e
20 June:
New Files:
Jun20Run1:/HV(g):4006/HV(p):700/Cosmics/10,000e
Jun20Run2:/HV(g):4006/HV(p):700/Cosmics/200,000e
Reviewed the detailed slow control manual to try and understand the process of data transfer between FEC and computer. Still have a few questions. Not sure if more appropriate to ask Sorin or Filippo.
1) How do you control where the FEC replies are stored or sent?
2) If SC is talking to the FEC, why does the input file to the command ./slow_control start0.txt contain the port address to the APVs.
3) What would happen if it was the port address to the FEC?
4) Is it possible to manually request single events from a FEC using just SC commands?
