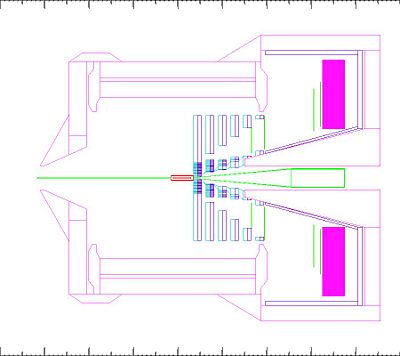
Solgemc GDML Visualization
From Hall A Wiki
Visualization in a 2D format using GDML can be done with ROOT's OpenGL implementation. solgemc will write out a GDML file of the geometry last run to solgemc.gdml which can then be shown using the geometry facilities in ROOT.
An example script to do this can be found below
ANOTHER OPTION: Directly through GEMC
Another way to create a 2D with WIREFRAME style uses a macro directly with GEMC. After have saved the picture one can then use latex to add grid, text, etc. (A possible outlook is this PDF )
- One needs to create a wireframe picture of the SoLID detector. An example of gcard in my geometry database is here (Save As to visualize). The macro used is here
- After saved both files, one will need to just execute the gcard: gemc -gcard=example_PVDIS_2D.gcard
- This will open the gemc window with a wireframe picture of solid (edit the gcard in order to picture your desired volumes from your desired geometry database).
- In order to simplify the editing, I have added an external polycone volume (solid_CLEO_ruler) That surrounds the solenoid and has tics over 10cm, 50cm, 100cm. The perl script used to define the volume is here. Edit the gcard or modify directly the visualization in gemc if you don't want it. This ruler volume is present in both user_geometry_6 (my geometry) and user_geometry (the default geometry), and helps verify the scaling of the picture.
