Backup
Maybe should go into a logbook.
Start date Sept 26, 2012
Bob Michaels, Kalyan Allada
Will work on adev account.
Want to use CODA 2.6. Save the old tcshrc file cp .tcshrc tcshrc_22feb2012
VME cpu bbvme1 presently on bbps1 2002
FADC library for VME /adaqfs/halla/adev/fadc/v1.2
crl is /adaqfs/home/adev/fadc/v1.2/fadc_list.crl
Decoding of FADC /adaqfs/halla/adev/fadc/ComptonAnalyzer
Attempts to make CODA 2.6 work on adev
1. Adjusted .tcshrc, adding things at top (comments there).
2. Create coda26 directory. Put $COOL_HOME there.
3. Minor problems. Had to start msqld by hand (/etc/rc.d/rc5.d/S82msqld_s on adaql2). Had to run cedit or dbedit on adaql1, not adaq1, b/c on adaq1 it complains cedit: error while loading shared libraries: libXm.so.3: (adaq1 has libXm.so.4)
4. Minor problems (part II). Needed links on adaq1, else CRLs don't compile. in /usr/local: ln -s /adaqfs/coda/vxworks-linux gcc-vxworks and ln -s /adaqfs/halla/apar/vxworks/5.5/gnu_vxworks gnu-ppc
5. Minor problems (part III). Can't run rcgui on adaq1 b/c missing libXtst.so.6. I guess it's looking in the wrong place since it's here: /usr/lib64/libXtst.so.6. Punt on adaq1. Use adaql1 (with the "l") for now.
6. startcoda on adev was a link to startcoda_2.5. Change this to startcoda_2.6
7. Bootscript on bbvme1 changed from /adaqfs/home/adev/bbite/vxworks/bbvme1_coda25.boot to /adaqfs/home/adev/vxworks/bbvme1_coda26.boot
8. Adjusted hardware address of TIR and FADC in CRL.
9. Started all the DAQ components "by hand" (startcoda not working yet). A working config is $SESSION=Compton, Configuration = Compton2. A seemingly ok data file is /adaql1/data4/AComp_1012.dat.0
10. "startcoda" and "kcoda" are now working on adev account. A working configuration is "Compton2".
to be continued ....
Date : 28th Sept 2012 (K.Allada)
1. As a first step trying to decode fadc data using /adaqfs/halla/adev/fadc/fDecode which prints data on screen.
2. The 'fadc_decode' prints data with any slot and crate number as an argument ...this is not expected.
3. I tried to change some parameters in the crl (such as PTW and PL) and the decoder shows correct changes made to PTW, at least that works!(run 1019)
4. Now I increased the delay of the trig to TI so as to catch the pulse (it wasn't sufficient), but the decoder still see no signal, only pedestal. (run 1020)
5. Added some more delay(~200ns) between trigger and signal, changed PL=100(400ns) and PTW=80(320ns) in the crl code. Now I can see the signal from the decoder in fDecode!! See halog (run 1028)
6. For now, this is the only working decoder (/adaqfs/halla/adev/fadc/fDecode)... more later.
Date : 1 Oct 2012 (R. Michaels)
1. Got my own version of fDecode to compile and run in ~adev/bob. Spent about an hour figuring out where the heck the slot number comes from (I did). Slot 5 for now.
2. Latency 300 nsec. Trigger window 260 nsec. I learned how to adjust this. Runs 1040 - 1045 are ok. I can see the data, and it moves to another channel when I move the input cable, but there are some strange things: (a) For data in chan 15, I see many times a repitition of the same ADC data, it's not physical. Meanwhile for chan 16, the data looks normal (monotonic, looks like a pulse). And (b) When I do run #N the first few events look like run N-1 conditions, as if the ADC is not cleared. Obviously, some work to do here.
3. Neither fDecode nor decoder_new compiles on adaq1. Instead must use adaql* (with the "L"). The CODA-related problems for adaq1 were allegedly fixed, so we may try running CODA there again sometime. I'm more interested in the FADC for now, though.
Date : 2 Oct 2012 (K. Allada)
1. I replaced the Lecroy linear Fan-in/Fan-out module with another one. This was most likely causing flat line on the input pulser signal, now it is gone.
2. Input pulse is ~400mV and the disc. threshold is set to ~300mV. On the scope everything looks clean, no jumping signals and flat-lines.
Date : 3 Oct 2012 (K. Allada)
1. I got Alexander's version of the decoder working and wrote my own script to display fadc channels on event-by-event basis. The new decoder is located at /adaqfs/home/adev/fadc/fadc_decoder. See README file to run the event display.
2. The Lecroy 428F unit in the NIM crate is a modified version, with two of the four outputs (B and D) capacitively coupled, hence stable. O/P A and C are unstable. Therefore always use o/p B and D for testing. (see diagram on the unit)
Date : 8 Oct 2012 (R. Michaels)
1. Decoder bug: If I turned on pedestal suppression (aka faSetThreshold), it exposed a bug in fadc_decoder, specifically that code looked for the channel to change, which it does not if only one channel has data. I fixed this in my private version (~/bob). My fix is somewhat awkward, so it may need to be checked.
2. I noticed that the reasons why an input signal appeared to be necessary to have triggers was some kind of grounding issue. If I just connect to ground the "ground" part of the LEMO input for data inputs on the FADC, the triggers occur. It is not necessary to have data, only this ground connection is relevant. If this connection is absent, the DAQ is stuck: no trigges. Very odd. I have asked the DAQ group why.
3. I added two scalers (Struck model 3800) to the crate. One for LEMO inputs and another for ECL inputs. Right now there is a "scread" (standalone code to read) in ~adev/scaler/compton/scread. Go there and type "scread" to see the data from the server. And "scread -c" to clear. It works. I have not yet added these scalers to the CRL, but it's easy -- I might do it tomorrow -- but it should be easy to remove (with a flag) since it will affect the ultimate speed of the readout. I suggest putting the readout at the end of the event structure. It will affect the decoder, too. The decoder should sense if there is a scaler or not.
4. I think what we want is a setup with a pulser (ideally random but can start with a fixed rate), use pedestal suppression on all but one channel, put the signal into that one channel, and observe how many FADC events we see versus how many triggers in in the scaler -- essentially measure the deadtime. We should map this out versus rate and see how limited the system is at present.
5. Task list: a) Try the internal trigger (HITSUM, or whatever) b) Need a random source of triggers (PMT in a box with controllable light leak) c) Question about the grounding (note 1 above). Other question about how to ignore a channel, i.e. no pedestal suppression but don't read out some channels. d) Measure deadtime versus rate. Can use scaler server to read at beginning and end of a long run.
Date : 10 Oct 2012 (R. Michaels)
Today's progress
a) Found out we can't use HITSUM internal trigger on this version (v2) of board; will get a new firmware someday.
b) I learned how to disable channels. At the moment, all but channel 5 (i.e. 5th) is disabled. Warning !
c) Found out we cannot try 2eSST mode, which should speed up VME by a factor of 2 to 4, b/c we have a 5100 board (need a 6100 board and the Tempe library)
d) Implemented a deadtime measurement on scope -- read out busy. Also, studied observed rate versus input rate.
Conditions: 5100 board, 100 Mbit ethernet, old TI (not the new one), no event blocking (b/c old TI), 1 channel readout, no pedestal suppression, but other channels disabled. The busy occurs 4 usec after the trigger. The VME readout deadtime is usually 25 usec, but fluctuates sometimes to 40 usec. This implies a max rate of order 25 to 40 kHz, which was observed (see below).
Data for a fixed-frequency pulser (later, it would be interesting to use a random trigger)
Input rate .... Observed rate .... deadtime
(kHz) ....... (kHz)
10.2 .......... 9.61 ............ 5.8 %
13.5 .......... 12.1 ............ 10.3 %
34.0 .......... 16.3 ............ 52 %
21.5 .......... 17.6 ........... 18.1 %
35.2 .......... 16.1 ........... 54 %
44.0 .......... 17.8 ........... 60 %
Looking forward to this improving with new cpu, new TI, event blocking, 1 Gbit ethernet, 2eSST, and whatever else we can think of.
Date : 11 Oct 2012 (A. Camsonne)
Lending one of HRS intel VME CPU to test with FADC Board is VXB601, MAC address is 00:20:38:04:6D:12 and hostname is hallasfi1.
To compile, first source sethallasfi1.sh to set the environment variables. Then you can compile in the linuxvme directory.
The FADC library is located in fadclib and the standard readout list is fadc_list.c
The ComptonIntel configuration was created. The Intel CPU is setup as ROC9 To start the ROC if it is not start execute the startroc9 script at the root directory.
I copied a version of the SIS scaler library for the linux VME CPU in /root/linuxvme/SISScaler this needs to be setup for this scaler ( VME addresses )
K.Allada: Things to check with intel CPU:
1) Repeat the the DT test done earlier. For this, we need scread to work on the hallasfi1
2) To compile /root/linuxvme/SISScaler/fadc_list.c, do "make rol".
Date : 12 Oct 2012 (R. Michaels)
Today:
1) I tried out the new Intel VME cpu (see Oct 11) and it works nicely. I learned about this setup and checked the data from the FADC.
2) I ported my scaler readout to the Intel VME cpu. After some effort to get Makefiles right, and reading https://coda.jlab.org/wiki/index.php/VxWorks_to_Linux_HOWTO I was able to get it to work, i.e. it can initialize, read, and clear scalers. Note, it's not a client/server anymore; at this point the code just runs on the Intel board. There will still be some benefit to having client/servers, and I'll work on that later.
3) Another very cool thing is that I demonstrated that I can use the serial port to talk to the HV main frame using primtive RS232 commands. This is nice, because it means that anywhere we have these cpus we can talk to HV crates.
Date : 15 Oct 2012 (R. Michaels)
Scaler readout using "scread" on hallasfi1 (Intell cpu): Type "scread" to read the two scalers in that VME crate. "scread -c" to clear. And "getrate" will make an printout of the rates (what's printed are values and you have to divide by 10 sec.)
I noticed that with the Intel VME board, there is a clear difference in readout speed when using 2eSST.
vmeDmaConfig(2,5,1) -- optimal. 26 usec for 1 channel
vmeDmaConfig(2,2,1) -- D32 is 4 times slower (100 usec).
In the present setup, a pulser provides the trigger and the data. The signal is discrimated and send to the TI board; the L1A is then sent to the FADC timing board, which feeds the FADC its trigger. The signal also goes to the data input on the FADC.
What is a bit wierd is that there is a 25 usec delay between the start of the readout (i.e. busy) and the trigger sent to the TI. This effectively adds 25 usec of deadtime to the system. I'd like to understand and possibly eliminate this. If we can, the system has a 26 usec DT in 2eSST, which implies a 40 kHz rate capability.
Date : 16 Oct 2012 (K. Allada)
1. Found that the data in the run I just took have a bunch of 0xf0000000 in the file. Compiled the readout list and took another run, still same ... something wrong.
2. Yesterday B.Moffit suggested me to use readout list version2 in /root/linuxvme/fadcV2/rol/fadc_list.c. So I changed the ComptonIntel config. to point to fadc_list.so in this location. Also, made made sure old and new lists are same.
Comment from Alexandre : we have an old FADC so fadcV2 will fail
3. Also /root/linuxvme/lib/libfadc.so is pointing to fadcV2/
4. I see 26usec DT and data contains only 0xf0000000. Not sure whats wrong.
5. Went back to old 5100 CPU and ran Compton2 config. Everything looks good in the data (no 0xf0000000). Also, I noticed that the delay between busy and the trigger sent to TI is 5-8usec (rather than 25 usec that is seen with Intel CPU).
6. ( Alexandre ) Intel CPU did not reboot, it did not pick up the IP address. I restarted the DHCP server on adaql2 : /etc/rc.d/init.d/dhcpd restart and the CPU booted fine.
Date : 17 Oct 2012 Theory of where we're going -- Bob Michaels
We want to demonstrate 1 MHz capability, or something approaching that, for the Compton photon readout.
The setup we have: 1 channel is read out from the FADC, the others are disabled. This 1 channel will be the Compton photon detector data.
Other parameters and discussion:
1. We have a window of approx 300 nsec, so that's 75 words at 250 MHz, plus about 5 for headers and trailers, etc, so about 80 words per event
2. The picture of the deadtime: A trigger comes into the TI board and it takes a time "Tz1" to interrupt the board and a time "Tz2" to read out. At present, with the Intel board, Tz1 = 25 usec and Tz2 = 26 usec, approximately. No way to reach 1 MHz !
3. In polling mode, Tz1 should be about 3 usec, I'm told. We have not demonstrated this yet in our setup, so there must be a mistake.
4. The overhead to read out is about 20 usec (Tz2), but not because of DMA transfer (which is 40 nsec per word, so 3.2 usec for 80 words). Instead Tz2 is dominated by the overhead of setting up, on the cpu, where to write the data. This setup time would get buffered away if we used event-blocking. Event-blocking requires the new TI board which we are waiting for.
5. In event-blocking mode, we can buffer the events on the FADC and read them all at once. The buffer size is 4 Mbytes. Given 80 words or 320 bytes per event (see 1), we could store 12.5 K events in the FADC -- a lot !
6. The DMA transfer speed in 2eSST is D = 40 nsec/word * number of words/event = 3.2 usec for our present setup (see 4).
7. Suppose we buffer 10K events. Then the readout time per event is (Tz1/10K) + (20 usec/10K) + D, where the first time is the polling delay, the 2nd is the setup time to prepare where to write on the cpu, and the D = 3.2 usec is the DMA transfer of 20 bytes per event. Clearly, the 3.2 usec dominates. This implies 313 kHz rate limit.
8. Ultimate speed limit ? If we get greedy and reduce the time window for pulses to 50 nsec (assuming the pulses fit) this could become D = 40 nsec * ((50 nsec * 250 MHz + 5)) = 0.7 usec, so deadtime-free at 1.4 MHz theoretical rate limit. With pipelining, the deadtime would be close to zero at this rate.
Please check this.
(K.Allada)
1. fadc readout list now pointing back to the one in /root/linuxvme/fadclib. I did "make" and that linked all the libraries back to this folder. This fixed the bad data (0xf0000000) issue.
2. I noticed that when the input rate is greater than ~9 kHz then coda hangs and stops taking data. Bob saw this issue earlier, and it is happening due to running scread when coda is running. Need to fix scread.
Date : 19 Oct 2012 (K.Allada)
1. Came down to the Hall with B.Moffit to take a look at our setup. Bryan noticed that "tirIntInit()" in the download routine is setting the TIR mode to "interrupt on trigger" even if we set the mode to polling at the beginning. The already included linuxvme_list.c will initialize the tir, so there is no need to initialize it again in the download routine.
2. After removing the tir initialization in the download the delay between the tir busy (BSY) and the readout from one of the TIR o/p (readout time) is about 3usec (which is what we expect). Now we are limited by the 26usec wide of readout time which can be overcome by using blocking (need new TI).
3. The maximum rate we could get is about ~10-12KHz at the moment, which is still less than the expected ~40KHz. Part of the reason why we get less max. rate is due the limitation in writing to the disk (disk speed). When we ask coda not to write to disk then we get max rate of about 20-22KHz. So disk speed seems to be a limitation!
4. Bryan pointed me to one of his earlier studies done to show the improvement in speed when using blocking mode using the new TI. See here: https://halldweb1.jlab.org/wiki/images/f/fa/Slide20.jpg. You can see that when blocklevel=1(something like our setup) the speed is limited by the data rate(flat).
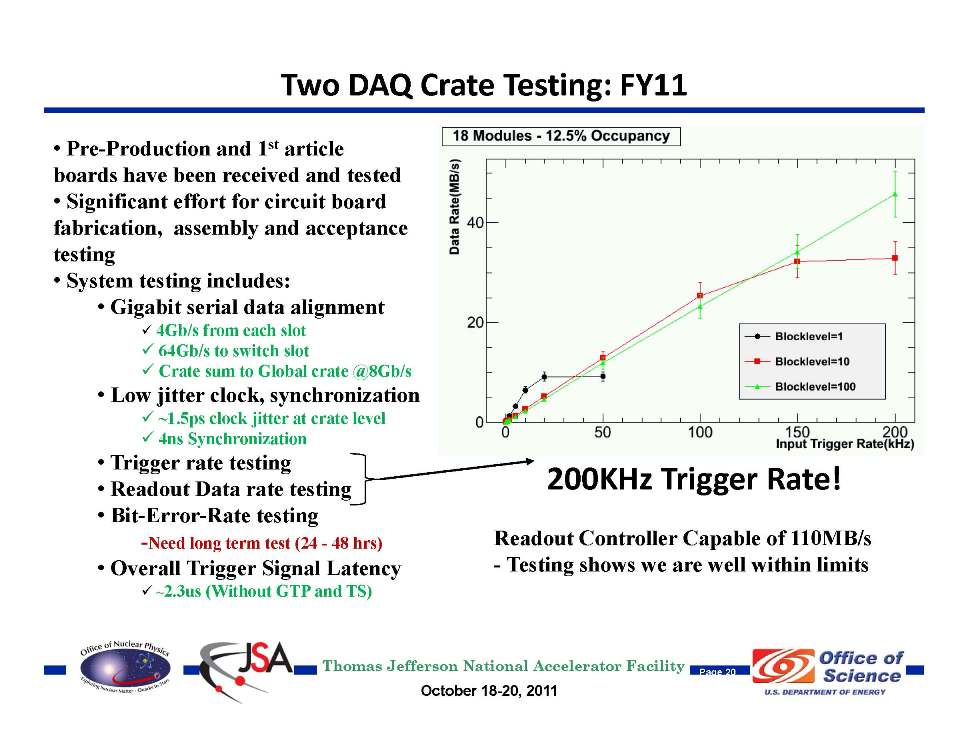
5. We are at the moment ready for a new TI and push the rate as much as possible.
Date : 21 Oct 2012 (K.Allada)
1. Disk write speed on adaql1 = 392 MB/s , on adaq1 = 1.1 GB/s
2. Use "dd" utility to find these numbers (Eg: run command "dd if=/dev/zero of=/tmp/output.img bs=8k count=256k", and remove the /tmp/output.img after done).
Date : 22 Oct 2012 (R. Michaels)
To simulate buffering, which would reduce DT, I tried to skip events (a number = BUFFSIZE) in the trigger routine, i.e.read out every BUFFSIZE triggers. What I expected was to see BUFFSIZE-1 empty events (this was observed) followed by 1 event with BUFFSIZE*W bytes, where W is proportional to the window size. Although I did see that W was proportional to window size, I only got one window's worth of data, as if the FADC is cleared each time it's read out. I posed the question to B. Moffit.
B. Moffit's answer was that we may be using the wrong block level. We were using 1. I tried block level BUFFSIZE (naive guess) and this did lead to somewhat more reasonable DT on the scope, but I didn't get any valid data b/c datascan = 0. Will keep trying tomorrow.
The original code fadc_list_save19oct.c was restored to fadc_list.c and compiled before I left. My test versions are *try*.c. Note, these versions would probably corrupt the decoder. I think the decoder may need to be modified to look for a header word to start the FADC readout. This would make it more robust against changes in the readout.
There was also a rash of annoying "not reporting" errors from CODA components. I attempted to write a well-posed question about these for the DAQ group. D. Abbott's answer is that we should use CODA 2.6.2. This we need to do anyway, in order to be able to use adaq1. I'll try this week.
Date : 23 Oct 2012 (R. Michaels)
Today I tried a bit more to read out multiple blocks (see Oct 22). No matter what, datascan is zero. This may have something to do with using older fadcLib because we have an older FADC hardware unit -- or something. It is not clear. But, this is exactly why one must push. Theoretical performance is not always matched by real life.
Next, I ported the DAQ to CODA 2.6.2 and the "adaq1" computer (without the "L"). And it works !
All components tested: EB, ER, rcgui, platform, et_start, dbedit, cedit. They all work now after some struggles (thanks partly to DAQ group and Ole Hansen).
Good news: the 58 second "not reported" messages have disappeared. D. Abbott said they probably would.
Some details: It's the TryAdaq1 config; similar to ComptonIntel. It's still on adev account, so .tchsrc was changed (old one saved). "startcoda" was modified to sense what computer; I think it would still work on adaql1 (using ComptonIntel) but I didn't try this lately. I also had to copy CODA 2.6.2 to the hallasfi1 board, and modify the setup script there. Data are written to /adaq1/data1. It is a big disk. Small glitches: I could not write to /adaqfs/coda (I think I need adaql3 to be up; it has root access), so I simply used /site/coda. Also, /adaqfs/appsroot/contrib is not "seen" by adaqfs; caused some minor trouble with kcoda.
Date : 24 Oct 2012 (R. Michaels)
I got the buffering to work (see fadc_try3.c, which I copy to fadc_list.c and compile).
Caution: We still should check the data to be sure, because it's possible the data are all garbage (I've seen this before under certain circumstances). The decoder does not yet handle these events. However, looking at the data with xcefdmp, it's clear the bits are fluctuating with time and the event length is about right for the window on the FADC, so that's a good sign.
Here is how the deadtime scaled. Note, "short read" is the readout code when we skip faReadBlock. "long read" is when we do faReadBlock
BUFFSIZE ..... Num words ...... DT of short read ..... DT of long read ...... avg DT

10 ........... 3936 .............. 5 usec ........... 110 usec ............ 16 usec
1 ............ 400 .............. N/A ............... 32 .................. 32
5 ............ 1984 ............. 5 ................. 74 .................. 19
20 ........... 7924 ............. 5 ................. 200 ................. 15
50 ........... 19596 ............ 5 ................. 464 ................. 14
This is with 2eSST and all but one channel disabled. Window size = 50. The number of words fluctuated a few percent.
For the latter case, the DT per word is 24 nsec, which is roughly consistent with the expected 40 nsec. Also, note that for 14 usec, the max rate is 71 kHz. Better, but not what we want yet.
Date : 26 Oct 2012 (R. Michaels)
Today I tried to make the BUFFSIZE even bigger, but I quickly found a limit. If BUFFSIZE=100 the DAQ was stable. 39.3K words per long read, with 910 usec DT. If I made BUFFSIZE=150 or bigger, ROC9 would segfaul, and also the EB would seqfault.
Interestingly, if ROC9 segfaults like this, you cannot do another run until you reboot the Intel PC. There is a message vmeBusLock: WARN: Previous owner of vmeBus (mutex) died unexpectedly
After rebooting the Intel PC, the DAQ works.
Not a very good day ...
Date : 1 Nov 2012 (K. Allada)
1. Noticed unusual behavior when setting PL and PTW windows in faSetProcMode() . When PTW gets close to the width of PL (within ~20ns) then I don't see the signal in the event display (only some part of tail exists). This turns out to be a problem with channel (#5)on the FADC. When I moved the signal to different channel, the problem is gone!
2. Wanted to test the "Pulse" and "Intergral" modes in the FADC.
- Copied Bob's fadc_try3.c to fadc_list.c and compiled. This list is meant for (pseudo) buffering
- Changed the mode to "pulse" in faSetProcMode. I did observe data every BUFFSIZE events. Same with "intergral" mode, but with much less data (as expected)
- I saw that DT for "short read" (see Bob's previous entry) is 0.5 usec and not 5 usec (typo above?)
- The PL (latency) was set to 75 (300ns) and PTW (window) was set to 50 (200ns)
Mode ....... BUFFSIZE ..... Num words ........... DT of short read ... DT of long read ...... avg DT

Raw .......  100 ........... 39316 .............. 0.5 usec ........... 875 usec .............. 9.25 usec
Pulse ...... 100 ............ 2092 .............. 0.5 usec ............ 70 usec .............. 1.12 usec
Integral ....100 ............ 604 ............... 0.5 usec ............ 35 usec .............. 0.85 usec
- This implies that with the integral mode (and with blocking) we can reach 0.85usec DT => 1.1 MHz!!
- Eventually, I assume, this is the mode we want to run for the Compton DAQ, and the "raw mode" can be used as a periodic check of the signal shape etc..
I restored the standard fadc_list.c with one change; Now the signal is in channel #7, so rest of them are disabled.
Date : 2 Nov 2012 (R. Michaels)
The above test is nice if the data are good. But if the data are all garbage ...
So, in order to check this I've modified the datastream in fadc_try3.c.
Empty events are like this
0x00000002  0x00000002  0xf000b10b
1st = 2nd = event count (two counters, should agree)
3rd = 0xf000b10b, it's a marker (for empty event)

Full events begin like this
0x00000064  0x00000064  0xfb0b0b0b  0x00000001  0x0000025d
1st and 2nd = event count
3rd = 0xfb0b0b0b, marker for full event
0x00000001 = datascan (1 or 0)
0x0000025d = nwords returned by faReadBlock
The rest are the words from  faReadBlock

A bad result would have nwords = 0 and the next line 0xda00bad2
Run 1334 is done with integral mode.
Run 1335 is done in Raw mode.
I'll analyze these offline.
Date : 5 Nov 2012 (R. Michaels)
The pseudo-buffered "raw" mode (as in run 1335, see Nov 2 notes) makes some sense offline. I see lots of raw pulses that look reasonable, though I didn't try to plot them.
The integral mode (as in run 1334) looks corrupted, so I'm not sure our tests up to now have a meaning. See a partial dump from a block read in run 1334 below.
The first number shown, 0x81432001, is interpreted as a BLOCK HEADER.
The next numbers have a structure: 1st column looks to the decoder like a "data type defining word", and the 2nd one is the same minus the leading 0x9. Also, these two columns look like counters: incrementing by 1 each time.
The 3rd and 5th column are increasing monotonically and are the same except for the leading 0x98 in col. 3.
Columns 4 and 6 are identical (actually, different by 1), and appear to be meaningless.
According to the manual, OPT=3 in faSetProcMode(FA_SLOT, OPT,75,WINDOW,3,6,1,0)
is supposed to to do Integral Mode, passing only a Sum and a TDC value for each pulse. At least I thought so.
Raw data from run 1334

0x81432001
0x900486f1  0x000486f1  0x9800a7ae  0x00328990  0x0000a7ae  0x0032898f
0x900486f2  0x000486f2  0x9800a7ae  0x00572a8e  0x0000a7ae  0x00572a8d
0x900486f3  0x000486f3  0x9800a7ae  0x008b0406  0x0000a7ae  0x008b0405
0x900486f4  0x000486f4  0x9800a7ae  0x00b1abea  0x0000a7ae  0x00b1abe9
0x900486f5  0x000486f5  0x9800a7ae  0x00d64f98  0x0000a7ae  0x00d64f97
0x900486f6  0x000486f6  0x9800a7af  0x000a25fe  0x0000a7af  0x000a25fd
0x900486f7  0x000486f7  0x9800a7af  0x0030d097  0x0000a7af  0x0030d096
0x900486f8  0x000486f8  0x9800a7af  0x00556f52  0x0000a7af  0x00556f51
0x900486f9  0x000486f9  0x9800a7af  0x00894922  0x0000a7af  0x00894921
0x900486fa  0x000486fa  0x9800a7af  0x00afedff  0x0000a7af  0x00afedfe
0x900486fb  0x000486fb  0x9800a7af  0x00d493b7  0x0000a7af  0x00d493b6
0x900486fc  0x000486fc  0x9800a7b0  0x00086b41  0x0000a7b0  0x00086b40
0x900486fd  0x000486fd  0x9800a7b0  0x002f1637  0x0000a7b0  0x002f1636
0x900486fe  0x000486fe  0x9800a7b0  0x0053b4bf  0x0000a7b0  0x0053b4be
0x900486ff  0x000486ff  0x9800a7b0  0x00878cd8  0x0000a7b0  0x00878cd7
0x90048700  0x00048700  0x9800a7b0  0x00ae34b6  0x0000a7b0  0x00ae34b5
0x90048701  0x00048701  0x9800a7b0  0x00d2d683  0x0000a7b0  0x00d2d682
0x90048702  0x00048702  0x9800a7b1  0x0006afe2  0x0000a7b1  0x0006afe1
0x90048703  0x00048703  0x9800a7b1  0x002d57ac  0x0000a7b1  0x002d57ab
0x90048704  0x00048704  0x9800a7b1  0x0051f4cc  0x0000a7b1  0x0051f4cb
0x90048705  0x00048705  0x9800a876  0x00840718  0x0000a876  0x00840717
0x90048706  0x00048706  0x9800a876  0x00b7e300  0x0000a876  0x00b7e2ff
0x90048707  0x00048707  0x9800a876  0x00de97d9  0x0000a876  0x00de97d8
0x90048708  0x00048708  0x9800a877  0x00033e1f  0x0000a877  0x00033e1e
0x90048709  0x00048709  0x9800a877  0x00371ce4  0x0000a877  0x00371ce3
Date : 6 Nov 2012 (R. Michaels)
I've learned that we have an "older" FADC, whose data format is slightly different. E.g. there are two FPGAs, etc. I also learned that my threshold was too high, so no PULSE INTEGRAL data. Setting this to 100, I see PULSE INTEGRAL data. I need to characterize how the results vary with threshold. I'm still not sure if this threshold is in ADC channels or what unit.
Since I had some saturation problems, I decided to calibrate the ADC in RAW mode. Here is how the peak ADC value varied for input voltage.
V (volts) .... ADC (peak)
0.3 ....... 1600
0.4 ....... 2000
0.5 ....... 2500
0.6 ....... 3000
0.8 ....... 3700
The numbers are averaged "by eye", so not very precise.
Next, I took some runs in PULSE INTEGRAL mode where I varied NSB and NSA (number of samples before and after threshold), and I also varied the voltage, and the PULSE INTEGRAL appeared to be linear in these. I need to do this more carefully, though.
There is a data synch problem: Some data may appear in run N from a previous run N-1. However, if I made the change (e.g. to the voltage) near the end or run N-1, the change appears in run N. Also, downloading seems to clear things. I need to characterize this problem some more. It could also be a software problem.
The good news from Kalyan's test : 36 usec for DT of the long read (BUFFSIZE 100) implying a greater than 1 MHz potential performance. And since the data now makes sense, I'm feeling better.
Date : 21 Nov 2012 (K. Allada)
- The new TI library is in /root/linuxvme/ti/ and the readoutlist is at /root/linuxvme/ti/rol/vme_list.c
- I added fadc readout to the the vme_list.c. Just do "make" to compile.
- A new CODA config is created. "NewTI" config uses vme_list.c (contains both TI and FADC readout)
- I got the FADC to work with new TI. However, at the moment, the readout is done using BANKS (BANK 4 = TI, BANK 6= FADC).
- Blocking mode works. Set the block size using BLOCKLEVEL
- There are some DMA error/warnings if the BLOCKLEVEL is too high. Need to fix this.
- I didn't get a enough time to do careful study of deadtime etc..
Date : 3rd Dec 2012 (K. Allada)
- I did some more checks to see if the data we are getting using the new TI is good or bad.
- First, I wanted to see if I can get the FADC "RAW" mode to work with the new TI.
- First, I made sure that I am using exactly same piece of code for FADC that used to work with old TIR module.
- When I run FADC in the "RAW" mode with new TI, I don't see a signal using the fadc decoder. I made sure that the data structure is same as the old one (no BANK etc..).
- Went back to old TIR config (with "RAW" FADC mode) to make sure I see the signal, and I did (it is plugged in chan 12)!
- At this point I am not sure what is wrong with the new TI config.
- Now I wanted to check "pulse integral" mode and blocking with new TI
- When using "pulse integral" mode with BLOCKLEVEL=100 events, I see only about 25% of the events in a particular block actually have "pulse integral" and "pulse time" information, rest of them don't have this information (see run 1559). That is wierd.
- Also, when the input trigger rate crosses ~200kHz, the datascan becomes zero and no more data is recorded. That is bad.
- The readout time is about 50us when I use BLOCKLEVEL = 150 and with ~200kHz trigger rate.
- I also disabled BANKS structure in the data so that we can compare it with the previous data using old TI.
- B. Moffit suggested using "tiSetTriggerHoldoff()" to fix the issue of "datascan" going to zero (see email)
Date : 4 Dec 2012 (K. Allada and R. Michaels)
Today we set the parameters of tiSetTriggerHoldoff(). At first, we could not receive above about 100 kHz data rate (started seeing deadtime), but we realized we needed tight parameters. With arguments of (1,4,1) we found we could read 365 kHz of data rate with ~zero deadtime. (I say "~zero" because it's not precisely measured yet.). This is as high a rate as the pulser can go. Pretty good start.
Next, we need some analysis software to do some data-quality checks. There were the mysterious observations before that some of the events in pulse-integral mode (how we were running today) has no data, and that raw mode wasn't working. This needs to be checked. The former may be a threshold setting, the latter might be analysis software.
Date : 5 Dec 2012 (R. Michaels)
There was an observation (considered possibly a problem) on Dec 3 that in pulse-integral mode, some events don't have data, i.e. pulse integral and pulse time are missing. I studied this a bit today and found that it appears to be dependent on the threshold set in faSetThreshold. It looks like if the threshold is 10 the efficiency is 100%, but if thr=100, the efficiency is much lower, typically 30 to 50% (fluctuates). What's more, the integral depends strongly on this threshold. So, we clearly need: 1) to develop a procedure to optimize this threshold, and 2) offline software to analyze all events.
Towards the 2nd goal, here are some runs to check and develop software, my next job.
run      rate      threshold

pulse integral mode
1587      436 Hz      10
1588      416 kHz     10
1589      416 kHz     100

raw mode
1592      416 Hz
Date : 2 Jan 2013 (R. Michaels)
After a 2 week vacation ....
Prior to X-mas, I wrote some code to decode and plot data for the block mode. I'm not completely done yet, however.
Also, Chris Cuevas gave me a Random Signal Source Module. It was a prototype built in 2002 by Fernando Barbosa. A small VME library exists from Hall B (Serguei Boiarinov and Sergey Pozdnyakov) and is presently on ~adev/vme/rpulser. I tested the outputs. There is a random output which, I think, is supposed to follow (at least roughly) the synch output in frequency. Some documentation from Fernando was put into the code. However, the module seems to not work well. I have sent these data to Chris and Fernando. Maybe they will have an idea for how to fix it.
The 2nd channel appears to have a synch output whose frequency matches expectation, but the random output is low and appears to "saturate" at about 1 kHz. Using the scope triggered with infinite persistence, it does seem as though the random output is random in time (= good and expected).
Observed frequencies (Hz) versus 16-bit register versus what it should be

register  source A (chan 1) source B (chan 2)   "should be"
           synch  random     synch  random       synch

Low Range
0xc075     21.6   16.4       22.8   15.3         22         good

0xc339     428    111        440    208          400        ok

Mid Range
0xa08a     25     17         2030   755          2K    chan 1 not working

0xa100     157   108         12.5K   922        12K

0xa392     434   126         34.3K   967        33K     random output is
                                                         saturating
High Range
0x601f     7.3   8.1         51.6K   965        50K

0x604d     14.9  11.3       102.3K   959       100K

0x63ff     449   129       2.89MHz   530      3MHz
Date : 2 Jan 2013 (R. Michaels)
I made some progress on my decoder for block readout. In ~adev/fadc/bob_decode It fills histograms like number of samples, number of events, snapshots of events (for raw mode), and integrals (for pulse integral mode), etc.
See halog 385750. http://hallaweb.jlab.org/halog/log/html/1301_archive/130102161435.html
Clearly, there is an optimization needed for the threshold. Also, I think the window timing was not right, since for run 1592 I don't see pulses in the window.
Date : 3 Jan 2013 (R. Michaels)
Today I carefully setup the timing in the TI mode and using my new software in ~adev/fadc/bob_decode. Some pictures and results are shown in halog 385751 http://hallaweb.jlab.org/halog/log/html/1301_archive/130103153652.html
Next, I checked how the DAQ deadtime (or livetime) depends on rate. While some features of the pulse-integral distribution are not understood, they appear to be invariant wrt rate. See halog 385752 http://hallaweb.jlab.org/halog/log/html/1301_archive/130103155233.html
It would be nice if we could post pictures here on the wiki; that's why I use the halog.
Next, we need to understand the pulse-integral distribution in more detail and we should try to find/borrow/scrounge a random pulser that goes to 1 MHz.
Date : 4 Jan 2013 (R. Michaels)
If the pulses are stable, the pulse integral distribution should be narrow. It wasn't yesterday. After some investigation, I found that this is a property of the pulser (or the downstream electronics) and is affected at high rates. At low rates the pulse integral is clean.
Halog 385754 http://hallaweb.jlab.org/halog/log/html/1301_archive/130104140402.html
But the TIME data seems peculiar. Here are some runs to check
run     mode     threshold

1631    integral   1500
1632    raw
1633    integral   1000
1634    integral   500
1635    integral   300
1636    integral   100  (in the noise)
1637    integral   1000
for run 1637, near event 52 (seen on GUI, so ~5200) I unplugged cable to FDC and inserted 15 nsec to calibrate TDC.  Then at
event 152 (seen, so 15.2K), I removed the 15 nsec and replugged cable.
1638    raw
Analysis of this is shown in HALOG 385755 http://hallaweb.jlab.org/halog/log/html/1301_archive/130104152816.html
It seems the TDC resolution is about 3.8 nsec (I guess 4 nsec is from 250 MHz), so this is ok. Also, the fluctuations in TDC are presumably due to the noise in the setup. Indeed, one can see these fluctuations in the RAW mode and on the scope. So, everything looks ok.
Date : 7 Jan 2013 (R. Michaels)
Today I got a random pulser from D. Abbott and repeated my scan from the other day. The livetime is 100% below about 500 kHz, then drops above that.
See halog 385756 http://hallaweb.jlab.org/halog/log/html/1301_archive/130107162055.html