ABSTRACT
Having found a 20% discrepancy in the hydrogen elastic cross-section between data from my thesis experiment and a MCEEP simulation, a comparison between the simulation programs MCEEP and SIMC was made. Comparisons were made using a very small collimator model to limit the acceptance and also using no collimator model. By using the same form factor model in both MCEEP and SIMC (the SIMC version) and fine tuning the radiation models and associated inputs, as well as making a background correction on the data, an agreement between MCEEP and the data at the 5% level (in total integrated yield) was obtained. The data and SIMC agreed to the 1% level and MCEEP and SIMC agreed to the 5% level (again in integrated yields). More work is always possible to bring the codes into even better agreement.
The Original Problem – 20% discrepancy in the elastic cross-section
 While analyzing the data from my thesis experiment
(E01015)
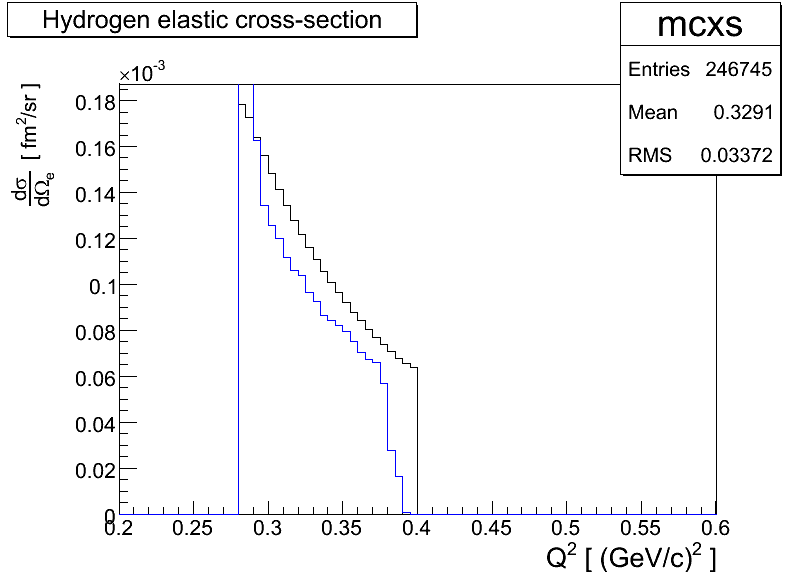
I found a 20% discrepancy between the hydrogen elastic cross-section I
extracted from the data and the cross-section predicted by MCEEP. This
discrepancy was present for different data runs at different
kinematics; one such example is shown in the first figure - the blue trace
is data and the black trace is MCEEP.
During discussions with Paul Ulmer, I learned that he has also found a
similar discrepancy with data taken during his deuterium experiment
(E01020)
several years earlier.
While analyzing the data from my thesis experiment
(E01015)
I found a 20% discrepancy between the hydrogen elastic cross-section I
extracted from the data and the cross-section predicted by MCEEP. This
discrepancy was present for different data runs at different
kinematics; one such example is shown in the first figure - the blue trace
is data and the black trace is MCEEP.
During discussions with Paul Ulmer, I learned that he has also found a
similar discrepancy with data taken during his deuterium experiment
(E01020)
several years earlier.
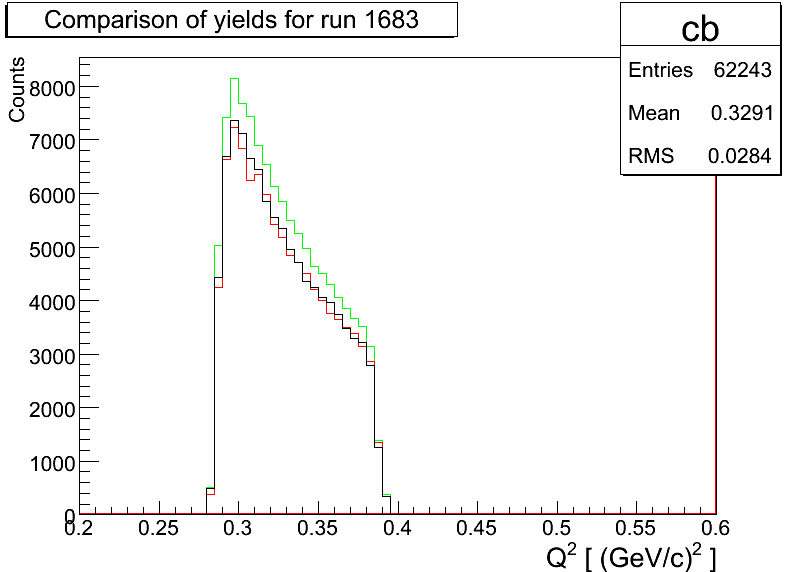
While investigating the possible causes of this discrepancy, I discussed the problem with John Arrington who agreed to run a simulation with SIMC, the code used for physics simulations in Hall C; this code also has the HRS models from Hall A encoded and available for use. Taking the simulation performed by John and comparing the radiated yield from SIMC with the yields from MCEEP and the data (taking into account any applicable efficiency factors), I found that SIMC was in much better agreement with the data than MCEEP as shown in the figure.
 Then, I proceeded to check both MCEEP and SIMC and compare them
together to see if there were any major differences which might cause
them to be inconsistent when compared with the data. The links in the
blue navigation bar on the left hand side will lead to further results
and plots from this investigation. The plots are linked to the full
eps versions of each image and individual links are also given on each
page.
Then, I proceeded to check both MCEEP and SIMC and compare them
together to see if there were any major differences which might cause
them to be inconsistent when compared with the data. The links in the
blue navigation bar on the left hand side will lead to further results
and plots from this investigation. The plots are linked to the full
eps versions of each image and individual links are also given on each
page.